Fig. 5
Download original image
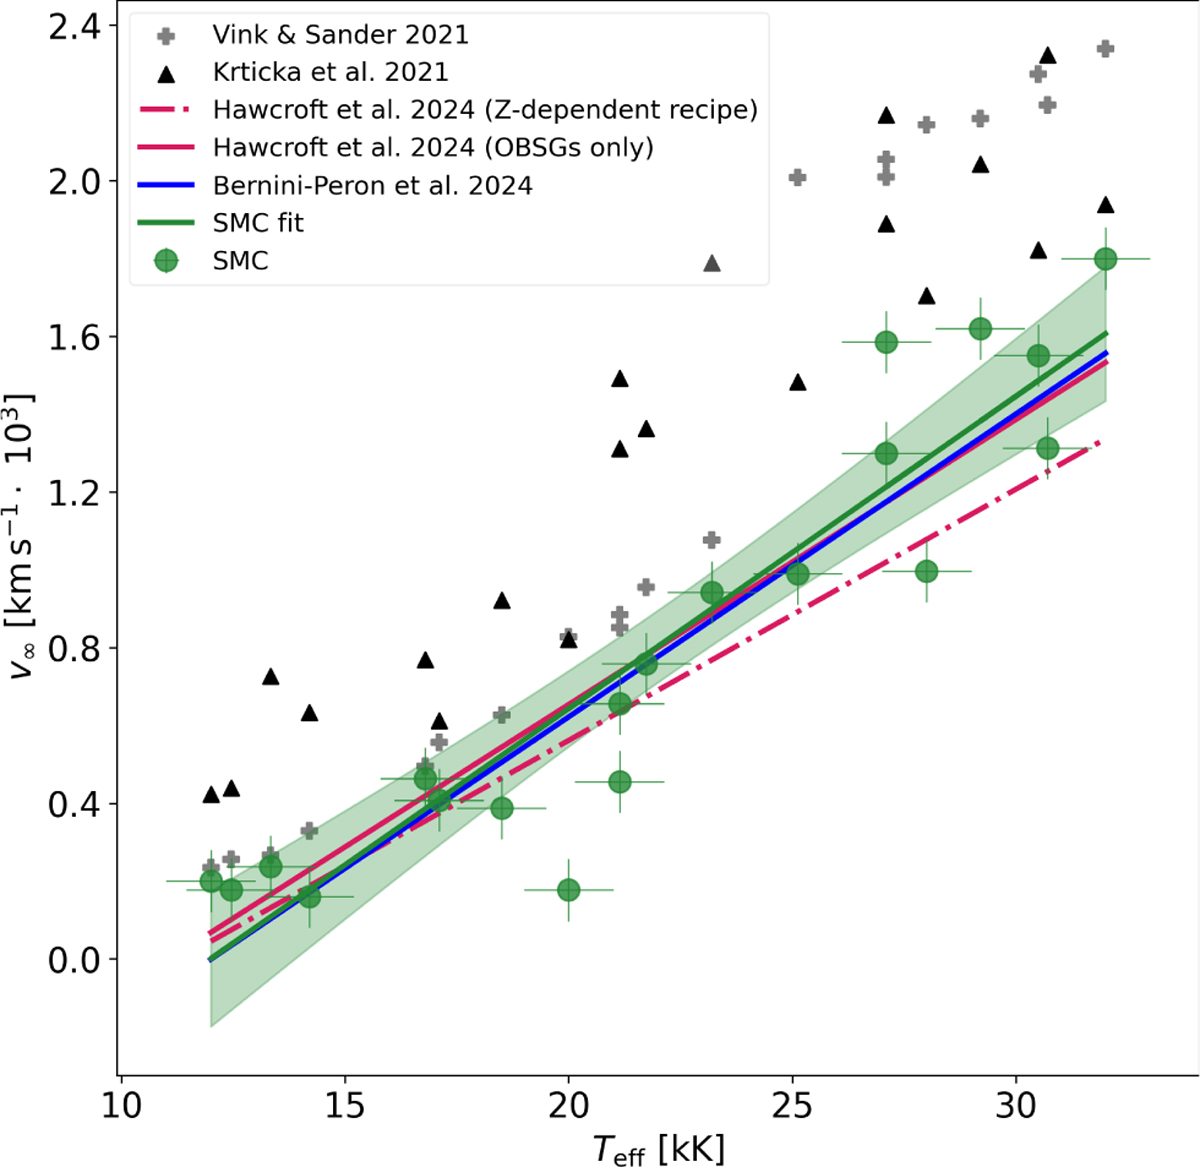
v∞ vs Teff. The green dots represent our results. The green line is the linear fit. The dashed magenta line is the Z-dependent v∞–Teff relation from Hawcroft et al. (2024b). The solid magenta line was obtained from fitting Hawcroft et al. (2024b) results for O and B supergiants only. The solid blue line was obtained from fitting the results of Bernini-Peron et al. (2024). The grey crosses are v∞ calculated from Vink & Sander (2021) recipe. The black triangles represent v∞, calculated from the recipe in Krtička et al. (2021).
Current usage metrics show cumulative count of Article Views (full-text article views including HTML views, PDF and ePub downloads, according to the available data) and Abstracts Views on Vision4Press platform.
Data correspond to usage on the plateform after 2015. The current usage metrics is available 48-96 hours after online publication and is updated daily on week days.
Initial download of the metrics may take a while.