Fig. 6
Download original image
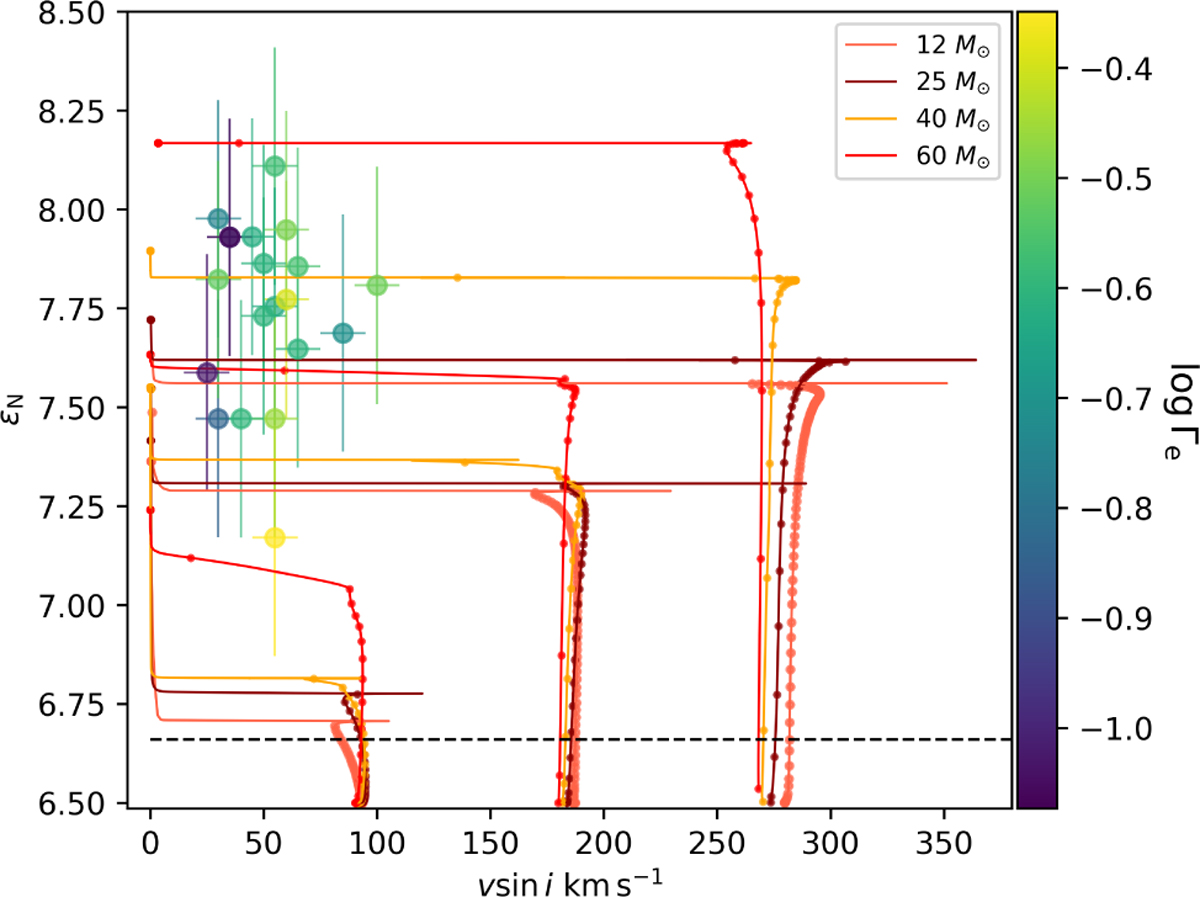
ϵN vs vrot sin i. The colour scheme corresponds to the value of Γe. The solid pink, brown, orange, and red lines represent SMC evolutionary tracks for initial masses of 12 M⊙, 25 M⊙, 40 M⊙, and 60 M⊙, respectively, with initial rotational velocities of 110, 250, 350 km s−1 (Brott et al. 2011). We multiplied by a factor of π/4 to take into account the inclination of the rotation axis (Hunter et al. 2008). The dashed black line represents the baseline ϵN in the SMC (Vink et al. 2023). The dots along the evolutionary tracks represent time steps of 0.1 Myr.
Current usage metrics show cumulative count of Article Views (full-text article views including HTML views, PDF and ePub downloads, according to the available data) and Abstracts Views on Vision4Press platform.
Data correspond to usage on the plateform after 2015. The current usage metrics is available 48-96 hours after online publication and is updated daily on week days.
Initial download of the metrics may take a while.