Open Access
Fig. 7
Download original image
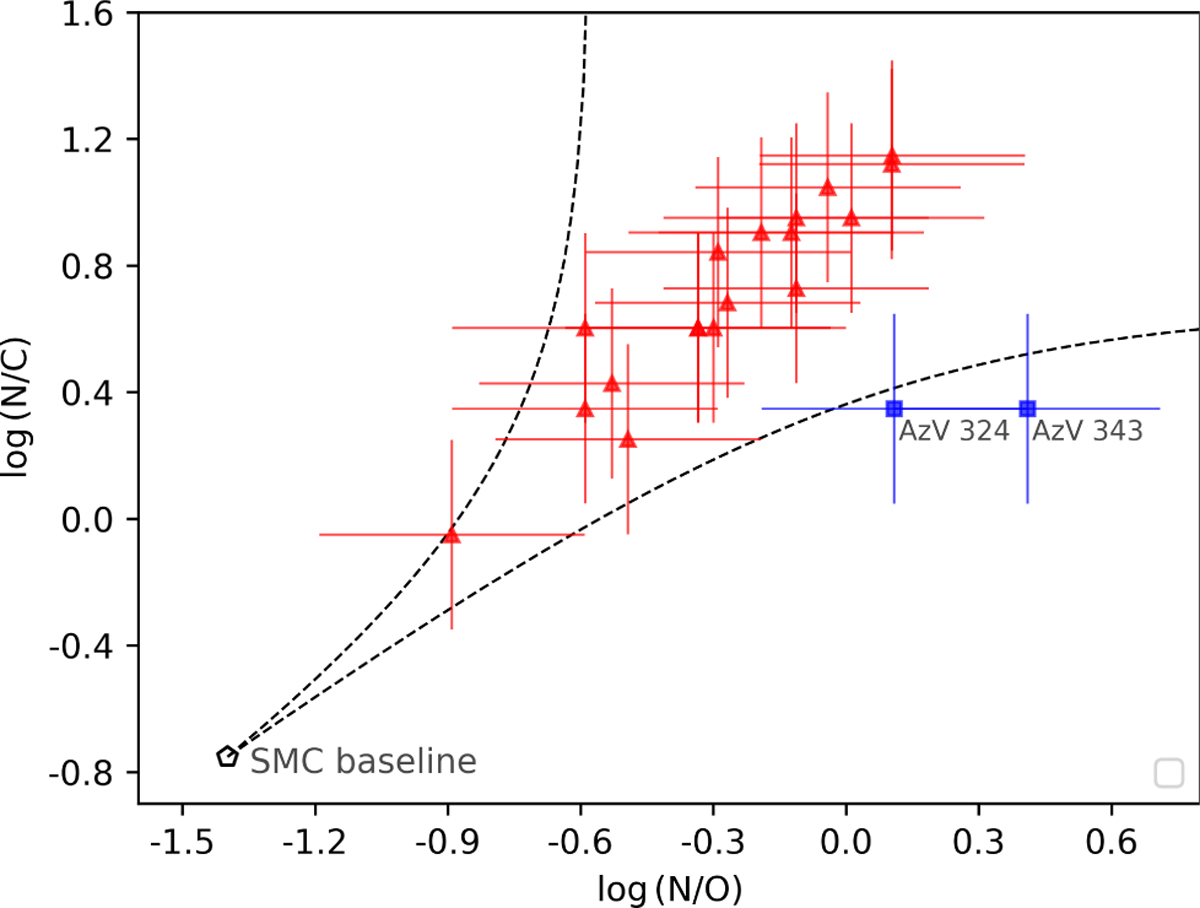
log N/C vs log N/O. The red triangles show the distribution of our sample. The stars for which the oxygen abundance was obtained from fitting the O i λλλ7772–7774–7775 multiplet are shown in blue squares. The dashed black lines represent the upper and lower boundaries adopted from Maeder et al. (2014).
Current usage metrics show cumulative count of Article Views (full-text article views including HTML views, PDF and ePub downloads, according to the available data) and Abstracts Views on Vision4Press platform.
Data correspond to usage on the plateform after 2015. The current usage metrics is available 48-96 hours after online publication and is updated daily on week days.
Initial download of the metrics may take a while.