Fig. 2.
Download original image
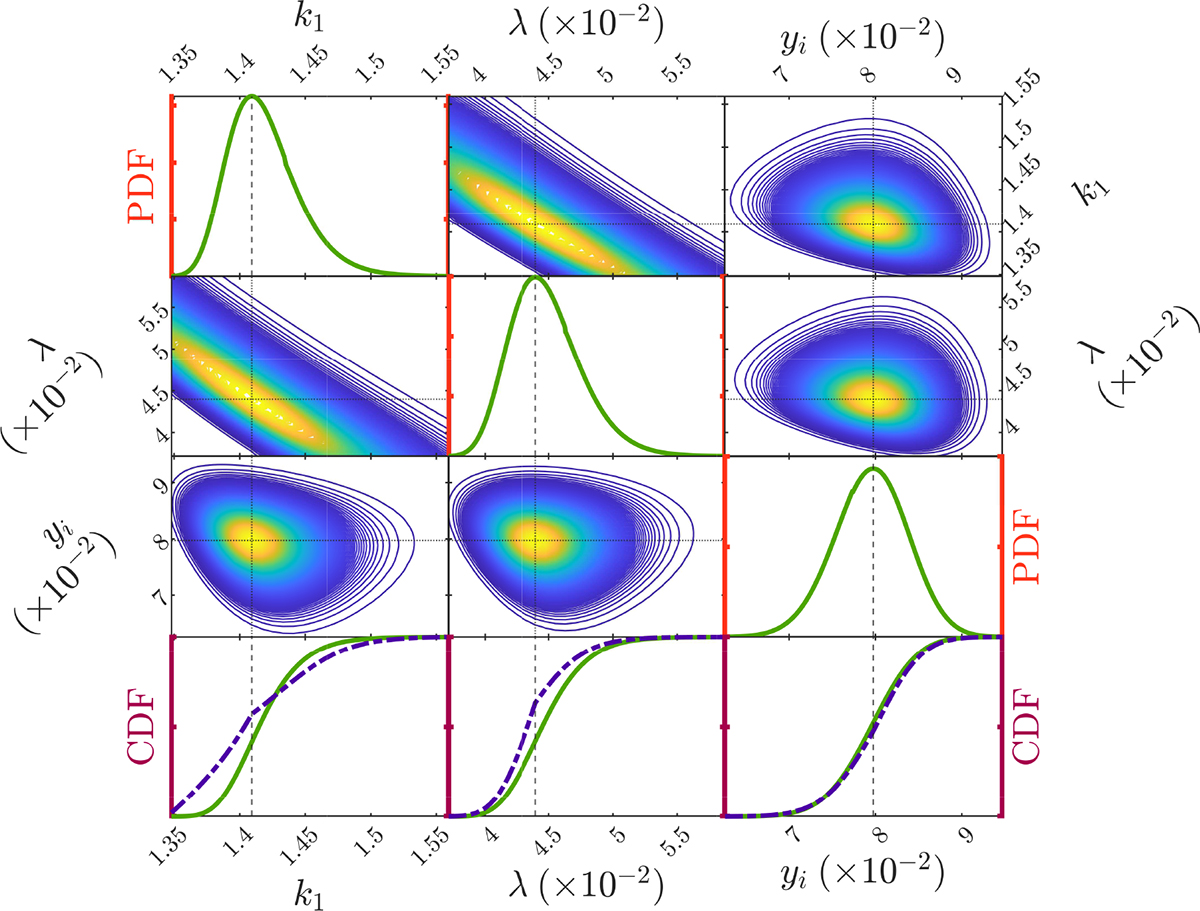
Mosaic of ![]() plots for SN 1987A. The color density maps show 2D slices of the log-posterior distribution with σ fixed, while two modeling parameters vary at a time. The diagonal panels display the posterior PDFs along each parameter axis, keeping the other parameters fixed at their best-fit values. The lower row shows the cumulative distribution function (CDF) for each parameter axis (solid line), compared to the CDF integrated on the entire space (dotted line).
plots for SN 1987A. The color density maps show 2D slices of the log-posterior distribution with σ fixed, while two modeling parameters vary at a time. The diagonal panels display the posterior PDFs along each parameter axis, keeping the other parameters fixed at their best-fit values. The lower row shows the cumulative distribution function (CDF) for each parameter axis (solid line), compared to the CDF integrated on the entire space (dotted line).
Current usage metrics show cumulative count of Article Views (full-text article views including HTML views, PDF and ePub downloads, according to the available data) and Abstracts Views on Vision4Press platform.
Data correspond to usage on the plateform after 2015. The current usage metrics is available 48-96 hours after online publication and is updated daily on week days.
Initial download of the metrics may take a while.