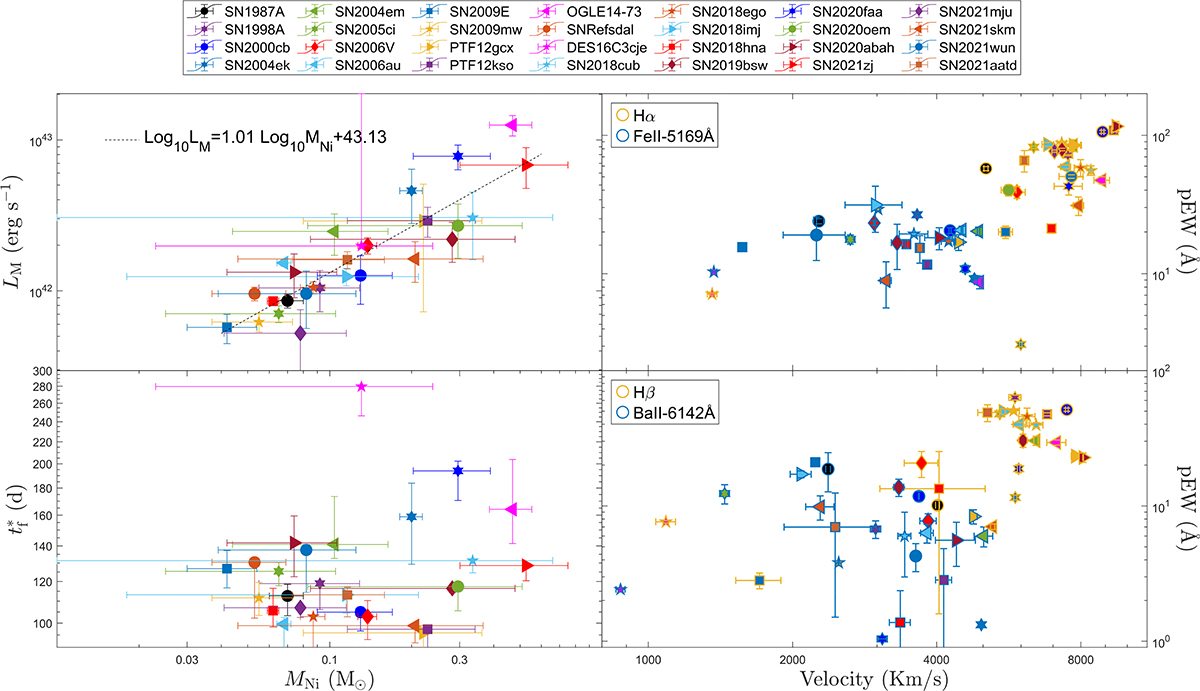
Fig. 3.
Download original image
Observational properties derived from the bolometric LCs and spectra of the SN sample. Top left: Distribution of the peak luminosity LM as a function of the 56Ni mass estimated from the radioactive tail fit. The trend line is obtained through a linear regression log10LM-log10MNi; the correlation is highly significant (p-value ≪ 0.01 and Pearson coefficient of 0.89). Bottom left: Distribution of tf* versus the 56Ni mass for the same SN sample. Top right: pEWs as a function of expansion velocities for the Hα and Fe II lines, for the SNe with available data. The color and shape of the markers follow the top legend, while the marker border indicates the line type according to the internal legend. Bottom right: Same as the top-right panel, but for the Hβ and Ba II lines.
Current usage metrics show cumulative count of Article Views (full-text article views including HTML views, PDF and ePub downloads, according to the available data) and Abstracts Views on Vision4Press platform.
Data correspond to usage on the plateform after 2015. The current usage metrics is available 48-96 hours after online publication and is updated daily on week days.
Initial download of the metrics may take a while.