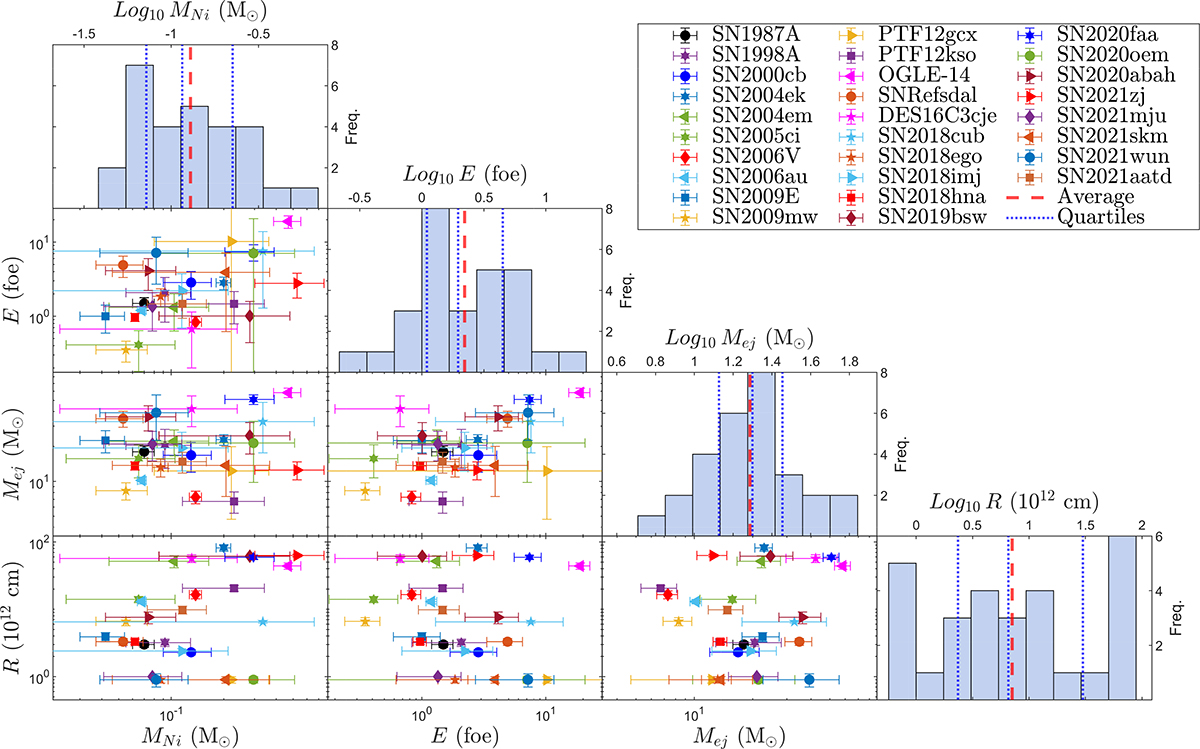
Fig. 5.
Download original image
Distribution of SNe physical properties. The diagonal panels show the histograms of the logarithm of each parameter (MNi, E, Mej, R), with the mean value (dashed line) and quartiles (25%, 50%, and 75%; see dotted lines) indicated. The lower triangular panels show scatter plots of the parameter pairs for each SN in the sample.
Current usage metrics show cumulative count of Article Views (full-text article views including HTML views, PDF and ePub downloads, according to the available data) and Abstracts Views on Vision4Press platform.
Data correspond to usage on the plateform after 2015. The current usage metrics is available 48-96 hours after online publication and is updated daily on week days.
Initial download of the metrics may take a while.