Fig. 6.
Download original image
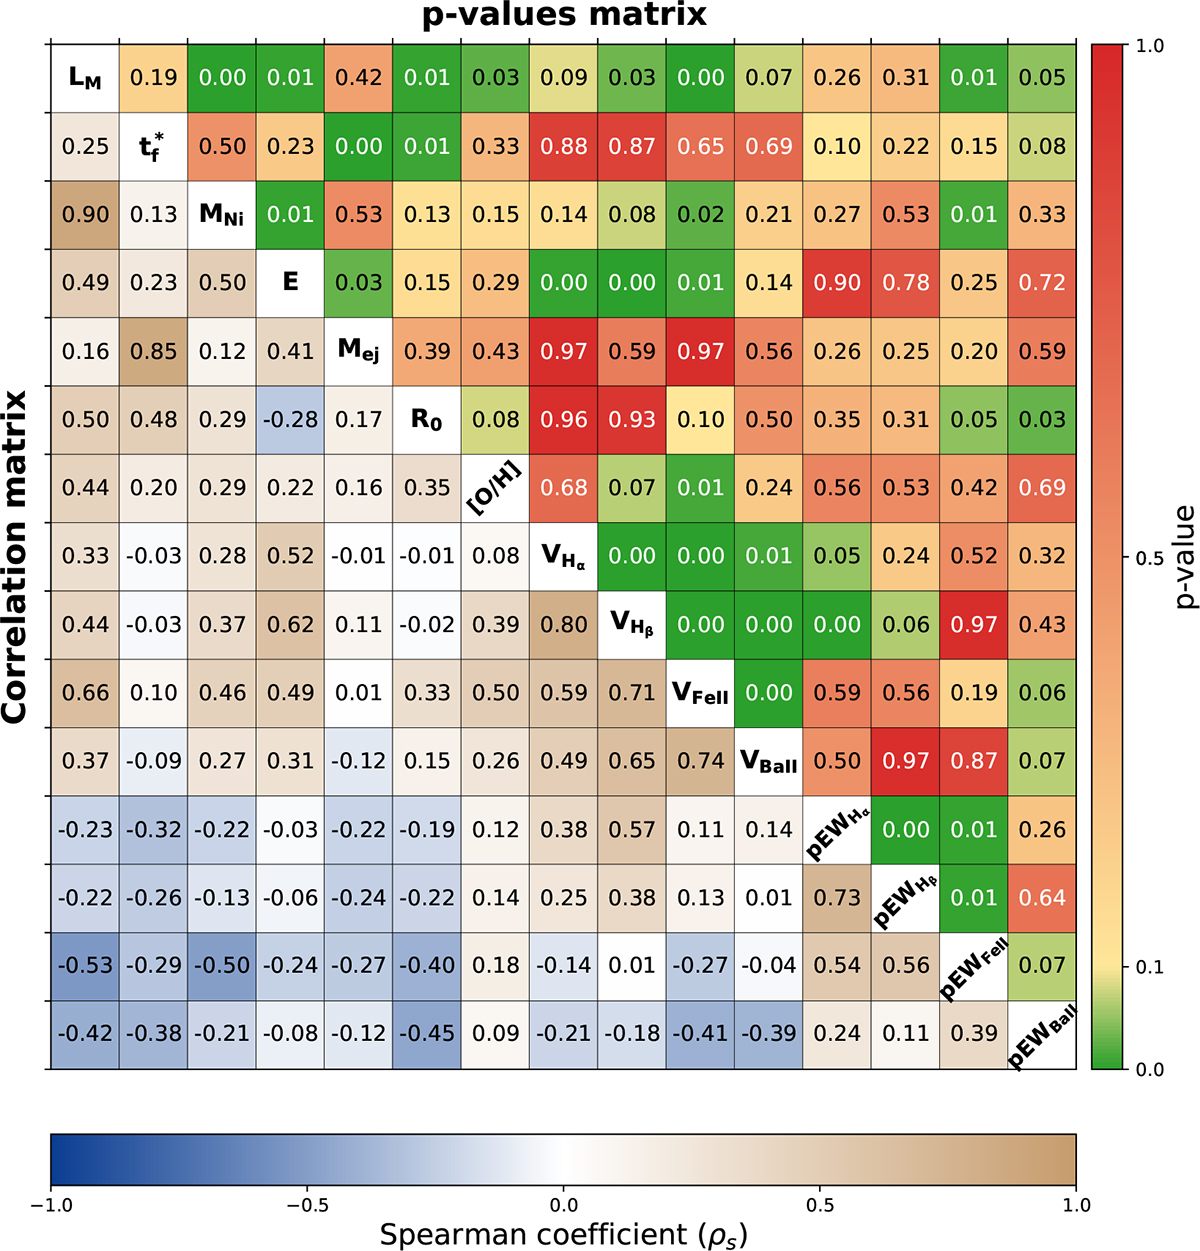
Spearman correlation matrix for the physical and spectroscopic parameters considered. The lower-left half of squares show the Spearman correlation coefficient (ρc), color-coded from –1 (dark blue) to +1 (light brown), with the numerical values reported inside each cell. The upper-right half of squares show the associated p-values, color-coded according to significance level (from green for high significance to red for non–significant values). The diagonal reports the labels of the parameters. In addition to the parameters discussed in the previous sections, we also include [O/H] = 12+log(O/H) listed in Table 2.
Current usage metrics show cumulative count of Article Views (full-text article views including HTML views, PDF and ePub downloads, according to the available data) and Abstracts Views on Vision4Press platform.
Data correspond to usage on the plateform after 2015. The current usage metrics is available 48-96 hours after online publication and is updated daily on week days.
Initial download of the metrics may take a while.