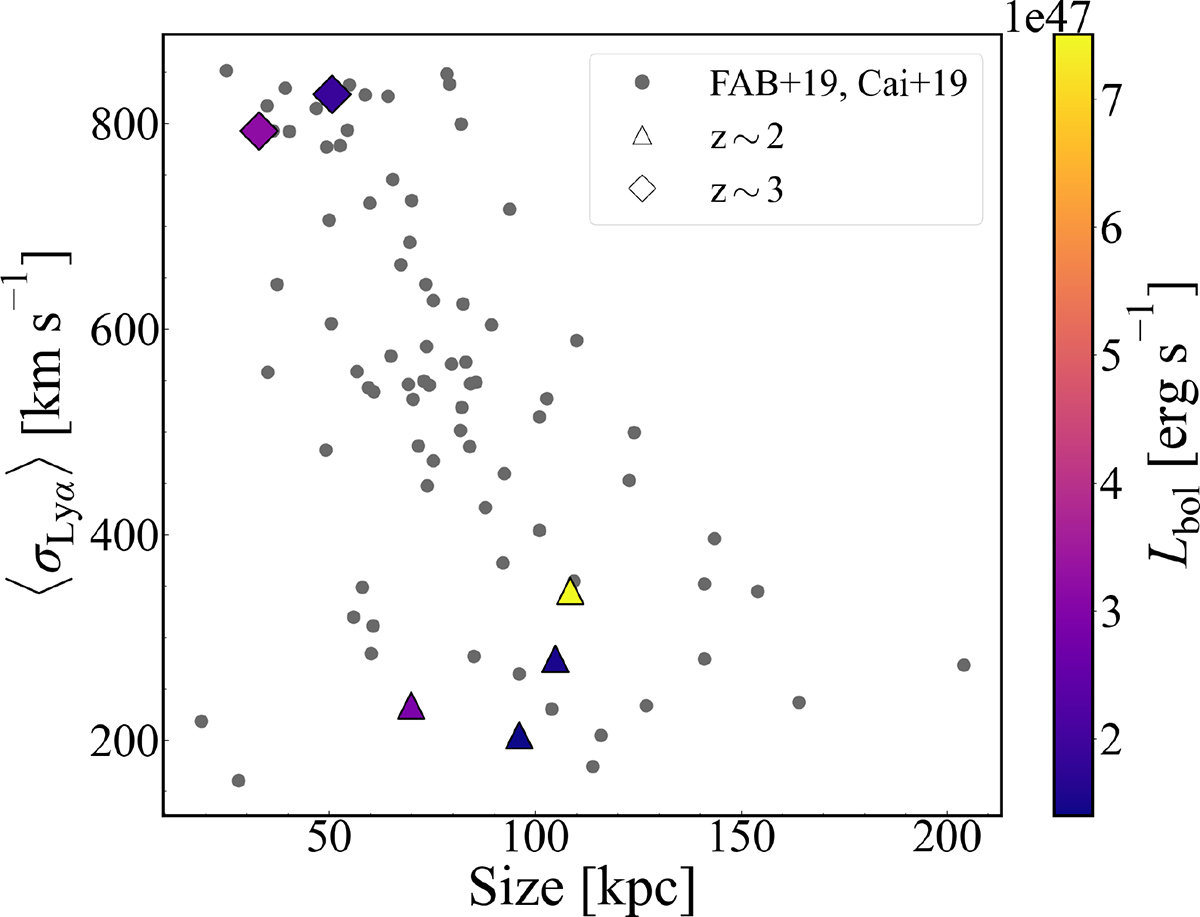
Fig. 1.
Download original image
Distribution of the Lyα nebulae around the targets in our sample in the velocity dispersion–size plane. The gray dots represent the parent sample from which our sources were selected, namely Arrigoni Battaia et al. (2019) (FAB+19) and Cai et al. (2019). Triangular and diamond markers indicate the targets selected for our study at z ∼ 2 and z ∼ 3, respectively. The points are color coded by bolometric luminosity, Lbol.
Current usage metrics show cumulative count of Article Views (full-text article views including HTML views, PDF and ePub downloads, according to the available data) and Abstracts Views on Vision4Press platform.
Data correspond to usage on the plateform after 2015. The current usage metrics is available 48-96 hours after online publication and is updated daily on week days.
Initial download of the metrics may take a while.