Fig. 2.
Download original image
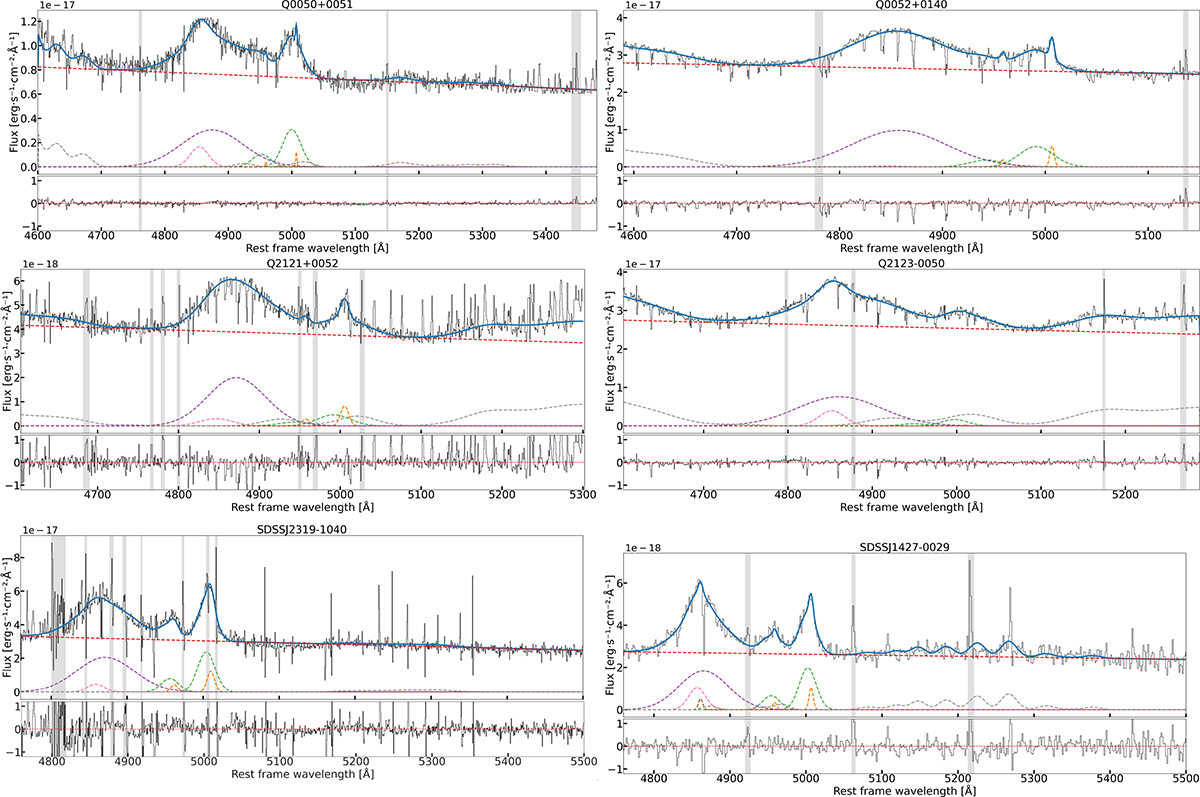
Modeling of the integrated spectrum with an aperture of one pixel around the quasar center. Top: Total spectral profile (solid blue line) and its individual components. The orange line represents the [O III] λ4959, 5007 NLR component. The green line represents the outflowing component in the [O III] λ4959, 5007 line. The Hβ line is modeled with a broad component for the BLR shown in purple, a narrow component for the NLR shown in brown, and an additional broad component for the outflowing gas in pink. The FeII emission is shown in gray, and the linear continuum is shown in red. Bottom: Residuals of the total fit. The gray-shaded bands in both panels correspond to remnant sky emission after applying the sigma-clipping algorithm mentioned in Sect. 4.1.1.
Current usage metrics show cumulative count of Article Views (full-text article views including HTML views, PDF and ePub downloads, according to the available data) and Abstracts Views on Vision4Press platform.
Data correspond to usage on the plateform after 2015. The current usage metrics is available 48-96 hours after online publication and is updated daily on week days.
Initial download of the metrics may take a while.