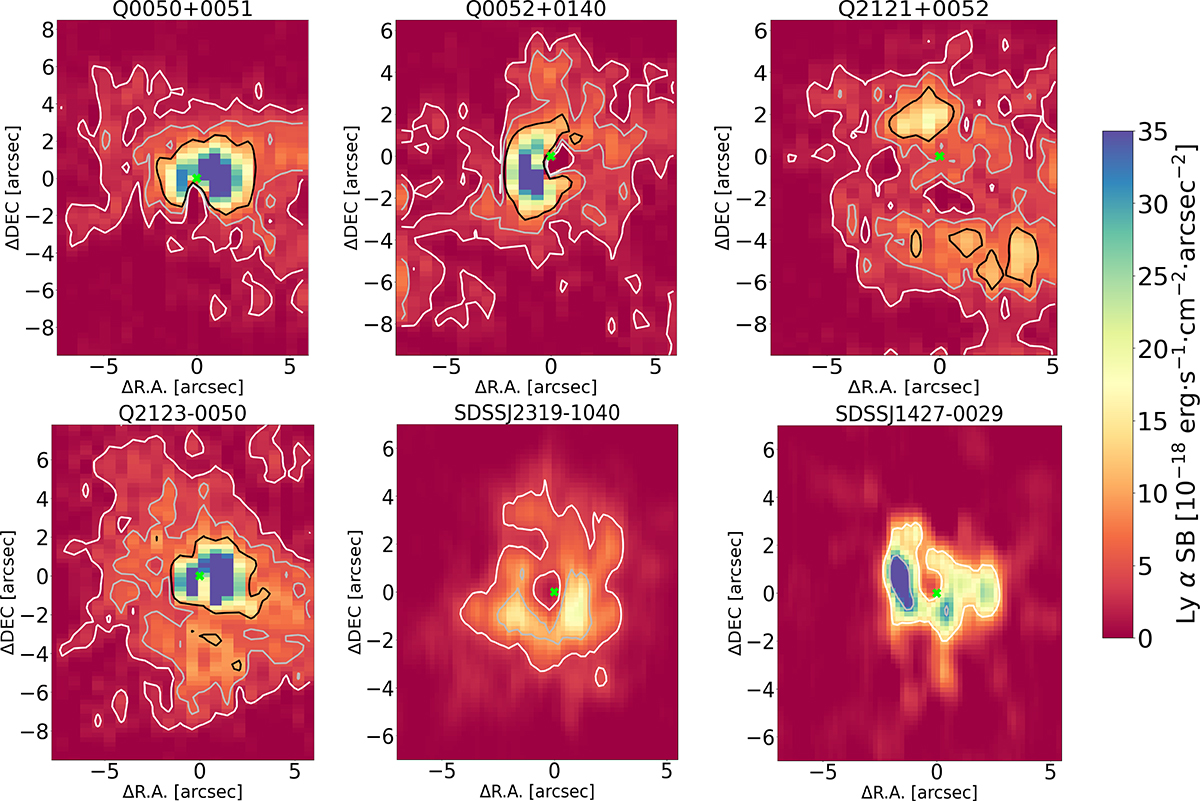
Fig. 3.
Download original image
Optimally extracted SB maps of the Lyα nebulae surrounding the quasars (see Sect. 4.2). The white, gray, and black contours represent 2σ, 5σ, and 10σ, respectively. The values of σ are reported in Table 2. The green cross in the center represents the position of the quasar, determined by estimating the photocentroid of a channel map in a wavelength where the Lyα line is not present. North is up; east is left.
Current usage metrics show cumulative count of Article Views (full-text article views including HTML views, PDF and ePub downloads, according to the available data) and Abstracts Views on Vision4Press platform.
Data correspond to usage on the plateform after 2015. The current usage metrics is available 48-96 hours after online publication and is updated daily on week days.
Initial download of the metrics may take a while.