Fig. 7.
Download original image
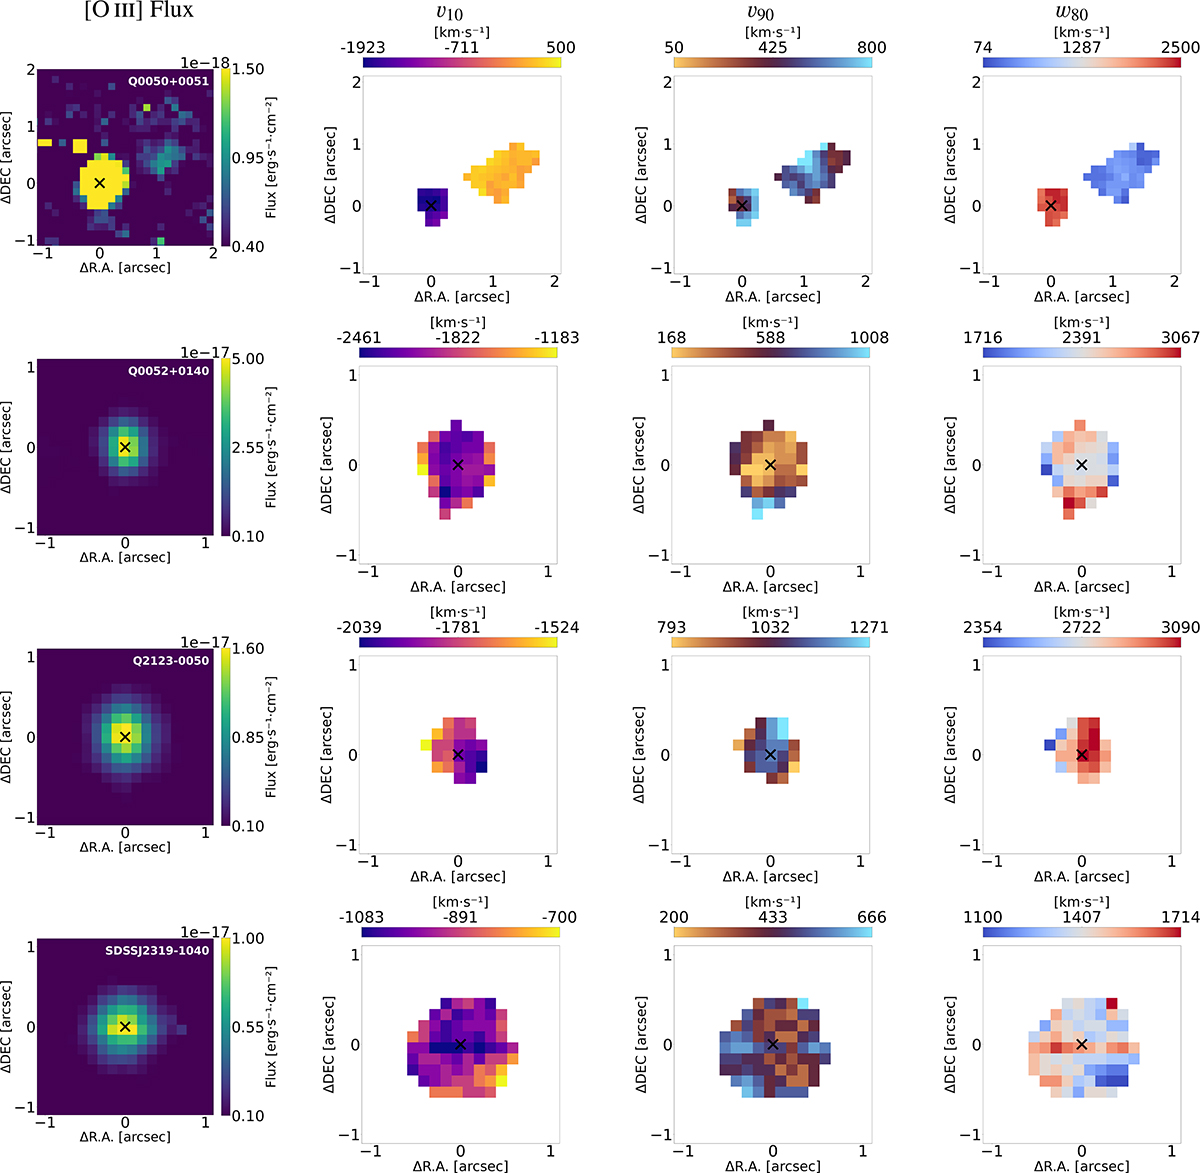
Flux and kinematics maps of the [O III] emission for the targets showing spatially resolved and/or extended emission. The first column shows the flux map of the [O III] emission. The second, third, and fourth columns show the v10, v90, and w80 velocity maps, respectively. The black cross marks the AGN center. North is up; east is left.
Current usage metrics show cumulative count of Article Views (full-text article views including HTML views, PDF and ePub downloads, according to the available data) and Abstracts Views on Vision4Press platform.
Data correspond to usage on the plateform after 2015. The current usage metrics is available 48-96 hours after online publication and is updated daily on week days.
Initial download of the metrics may take a while.