Fig. 1
Download original image
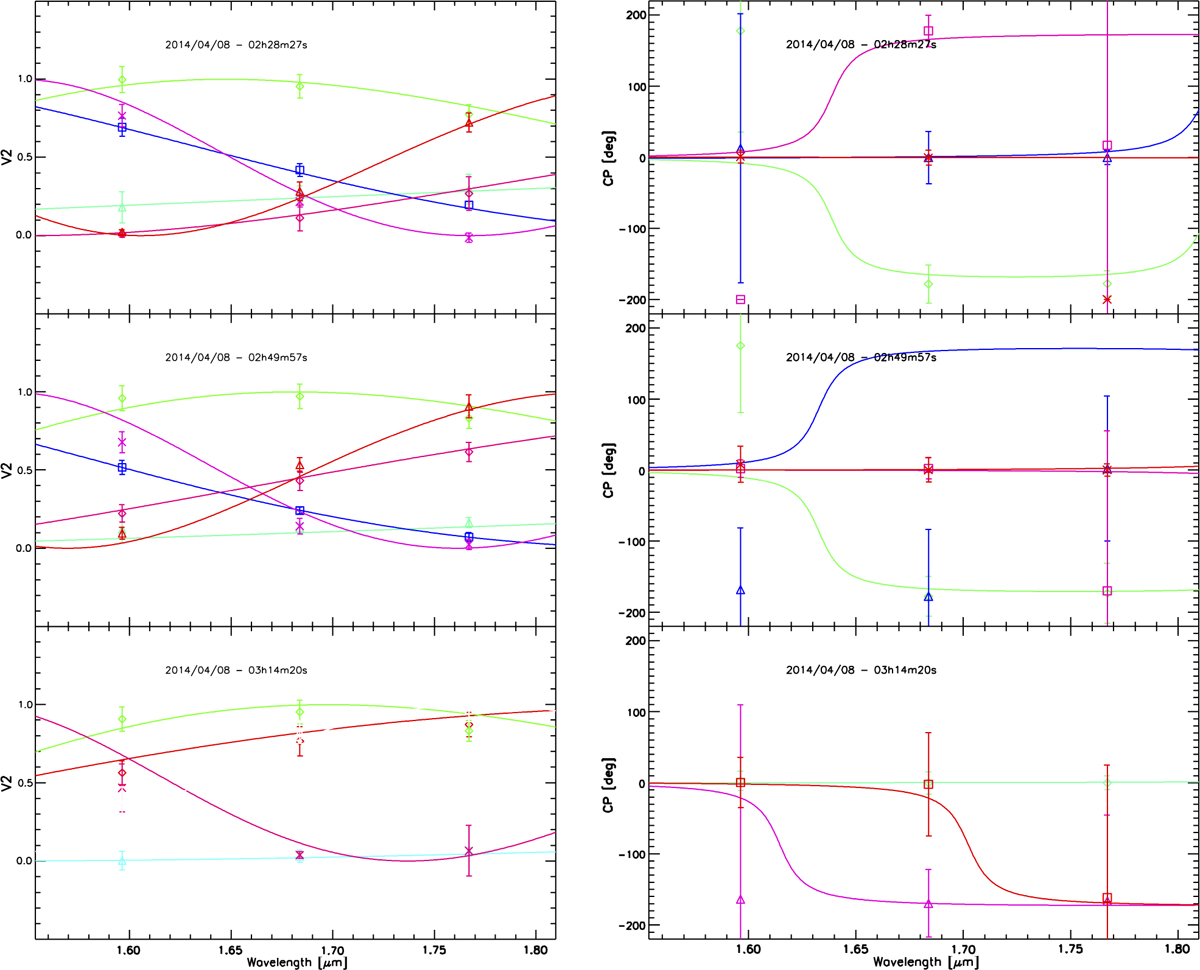
Left: squared visibilities as a function of wavelength, obtained for the three observing blocks (three panels) and six baselines (depicted with six different symbols and colours), along with the best-fit binary model described in Sect. 5.2.1 (solid lines). Right: same as the left, but for the four closure phases obtained in each observing block. Some of the squared visibilities and closure phases are not displayed for the third observing block. They have not been used in this analysis, due to the poor data quality.
Current usage metrics show cumulative count of Article Views (full-text article views including HTML views, PDF and ePub downloads, according to the available data) and Abstracts Views on Vision4Press platform.
Data correspond to usage on the plateform after 2015. The current usage metrics is available 48-96 hours after online publication and is updated daily on week days.
Initial download of the metrics may take a while.