| Issue |
A&A
Volume 707, March 2026
|
|
|---|---|---|
| Article Number | A166 | |
| Number of page(s) | 17 | |
| Section | Interstellar and circumstellar matter | |
| DOI | https://doi.org/10.1051/0004-6361/202557878 | |
| Published online | 12 March 2026 | |
Follow-up of three exocomet-host candidates
1
Observatorio Astronómico Nacional (OAN-IGN),
C/ Alfonso XII 3,
28014
Madrid,
Spain
2
Facultad de Ciencias Físicas, Pl. de Ciencias 1, Universidad Complutense de Madrid,
28040,
Madrid,
Spain
3
European Space Agency (ESA), European Space Astronomy Centre (ESAC),
Camino Bajo del Castillo s/n,
28692
Villanueva de la Cañada, Madrid,
Spain
4
Centro de Astrobiología (CAB),
CSIC-INTA, ESAC Campus, Camino Bajo del Castillo s/n,
28692
Villanueva de la Cañada, Madrid,
Spain
5
STAR Institute, Université de Liège,
Allée du Six Août 19c,
4000
Liège,
Belgium
6
Department of Astronomy and Steward Observatory, University of Arizona,
393 N Cherry Ave., Tucson, AZ
85721-0065,
USA
7
Large Binocular Telescope Observatory, University of Arizona,
933 N Cherry Ave., Tucson, AZ
85721-0065,
USA
★ Corresponding author: This email address is being protected from spambots. You need JavaScript enabled to view it.
Received:
28
October
2025
Accepted:
19
January
2026
Abstract
Context. Exocomets are small bodies that evaporate when they approach their host star. They can be detected based on the variability of non-photospheric features using spectroscopy and/or asymmetric transits in time-series photometry. Over the past four decades, about 30 systems have exhibited such variations and have therefore been classified as exocomet host stars. However, some recent publications have pointed out mechanisms that might mimic exocometary features. Therefore, careful monitoring is needed to confirm the origin of the observed variability.
Aims. In this paper, we aim to investigate the exocomet nature of the non-photospheric variable features observed in the exocomet candidate stars HD 36546, HD 42111, and HD 85905. All of them have shown some degree of variability, particularly in their Ca II K line.
Methods. We analysed the non-photospheric Ca II K line features from high-resolution spectra obtained using new NOT/FIES and Mercator/HERMES, along with some additional archival spectra of the target stars. The variability was quantified through the changes in the equivalent widths of those features, which are assumed to be of circumstellar origin. The column densities were also estimated for each variable feature.
Results. Strong variability was found for HD 85905, consistent with a potential link to exocometary activity. However, the binarity of the system, which we confirmed through interferometric VLTI/PIONIER observations, complicates the interpretation of these signatures and prevents us from drawing definitive conclusions. The remaining two sources do not show any significant variability, but due to the sporadic nature of the exocometary events, we cannot discard the exocomet hypothesis. Further monitoring of the stars will be necessary to carry out a robust determination of the variability patterns and timescales that would completely rule out other scenarios.
Key words: comets: general / binaries: spectroscopic / circumstellar matter / stars: early-type
F.R.S.-FNRS Research Director.
© The Authors 2026
 Open Access article, published by EDP Sciences, under the terms of the Creative Commons Attribution License (https://creativecommons.org/licenses/by/4.0), which permits unrestricted use, distribution, and reproduction in any medium, provided the original work is properly cited.
This article is published in open access under the Subscribe to Open model. This email address is being protected from spambots. You need JavaScript enabled to view it. to support open access publication.
1 Introduction
Since the discovery of exocomets around the β Pic system (Hobbs et al. 1985; Ferlet et al. 1987), there is a clear heightened interest in the study of minor bodies around other stars, despite the inherent difficulties related to their detection. Comets and minor bodies are the most abundant objects in the Solar System and some works have even pointed to the fact that the Oort cloud could host an abundance of comets of the order of 1012 (Dones et al. 2004). On the other hand, their potential contributions to supplying water or organic molecules associated with life on Earth are also relevant (Lis et al. 2019; de Val-Borro et al. 2014; Cao et al. 2024). In addition to the intensive search for exoplanets, the detection of exocomets is an important piece of the puzzle to understand the processes involved in the formation of planetary systems.
Exocomets are small bodies that evaporate as they approach their host star, developing a trail of dust and/or gas that resembles the coma and tail of comets in the Solar System. They can be detected through the variability in the circumstellar absorption components superimposed on the photospheric Ca II K line (e.g. Kiefer et al. 2014b) or in their photometric light curve as the exocomets transit before the star (Zieba et al. 2019; Pavlenko et al. 2022; Dumond et al. 2025; Norazman et al. 2025). The spectroscopic variability of the non-photospheric features is interpreted within the so-called falling evaporating bodies (FEBs) scenario (Beust et al. 1990), in which the icy bodies sublimate as they approach the star, releasing a gas cloud that produces the circumstellar absorptions. Around30 systems are known to exhibit features in their spectra that could be attributed to exocomets (Rebollido et al. 2020; Strøm et al. 2020). Most of the objects are rapidly rotating A-type stars. Only a few systems, including some F-type stars, display photometric variations, with β Pic (Lecavelier des Etangs et al. 2022) and HD 172555 (Kiefer et al. 2023) being the only ones where exocomets have been found both in spectroscopy and photometry. However, spectral variations are not always produced by exocomets; some works (e.g. Montesinos et al. 2019; Eiroa et al. 2021) have shown that long-term monitorings over different timescales are necessary to discard different alternative scenarios (i.e. binary systems, circumstellar disks, or envelopes).
The importance of debris disks cannot be ignored in this context, since they are linked to exocometary activity (Rebollido et al. 2020). Debris disks are made up of dust and (to a lesser extent) gas, although historically they were thought to be gas free because the host star ultraviolet photons can photodissociate the gas in protoplanetary disks in short timescales. However, CO has been found in ∼ 25 systems (e.g. Marino et al. 2016; Kral et al. 2020; Rebollido et al. 2022; Moór et al. 2025) in far-infrared (FIR) and sub-millimetre (sub-mm) observations, and measurements in CO absorption lines can set up a limit to the vertical distribution of gas in debris disks (Worthen et al. 2024). The question of whether gas in debris disks is a remnant of protoplanetary disks or second-generation material is still a matter of debate.
In this work, we analyse high-resolution spectra of three stars with significant non-photospheric variations in the Ca II K line, that have been attributed to exocomets. The paper is organised as follows. In Sect. 2, we summarise some properties of the three stars. In Sect. 3, details of the observations, telescopes and instruments, setups, and dates are given. In Sect. 4, we describe the methodology used. In Sects. 5 and 6, we present the results and discussion, placing a special emphasis on HD 85905, given its newly discovered binary architecture and the large variations observed. In Sect. 7, our key conclusions are presented.
Stellar parameters.
2 Selected sample
The three objects selected for this study have shown non-photospheric variable features in the Ca II K line (Rebollido et al. 2020). Table 1 shows some of their basic stellar parameters. To set this work in context, we give some specific details of the objects studied below.
HD 36546: this young star hosts a cold debris disk that was first imaged by Currie et al. (2017) using Subaru/SCExAO, with a subsequent multi-wavelength study carried out by Lawson et al. (2021). The debris disk around the star is not observed perfectly edge-on (i ∼ 70°−75°). With an age estimated to be ∼ 3−10 Myr, the system is an ideal target to study a debris disk shortly after its formation. Lisse et al. (2017) concluded that the disk had already lost its primary gaseous composition and reported an overabundance of C that could be linked to a recent giant collision. Furthermore, using ALMA observations, 12CO and 13CO gas in the disk and in the continuum was detected (Rebollido et al. 2022).
HD 42111: Grady et al. (1996) reported a weak shell absorption using International Ultraviolet Explorer (IUE) high-dispersion spectra with the strongest absorption centred on the star radial velocity, pointing to the presence of low-velocity circumstellar gas around the star. Welsh & Montgomery (2013) studied the circumstellar environment and detected weak absorption features superimposed on the Ca II K line and a sporadic FEB event.
HD 85905: sporadic circumstellar Ca II and Na I absorptions, similar to those observed in β Pic, were interpreted within the FEB scenario (Welsh et al. 1998; Redfield et al. 2007). In the latter work, the significant Ca II column densities estimated and the variability observed could not be explained by interstellar medium (ISM) absorptions, which led the authors to propose the existence of a dust and gas disk around the star. In the present work, we use VLTI/PIONIER observations to show that the star is an almost-equal flux binary (see Sect. 5.2), creating an even more complex scenario to explain its variability.
The variability reported for the three objects in Rebollido et al. (2020) was noted from observations carried out in the period 2015–2017 with the same telescopes and instruments used for the purposes of this work, as detailed in Sect. 3 (see Table 1 of Rebollido et al. 2020, for details). We defer to Sect. 4.2 of that paper and the associated figures showing comparisons among spectra of the different campaigns (Figs. 8 and 9 for HD 36546, 13 and 14 for HD 42111, and 17 and 18 for HD 85905). The kind of variability observed was of different type: a typical redshifted β Pic-like event in HD 36546, subtle changes of the Ca II H and K profiles in HD 42111, and dramatic variations both in Ca II K and Na I D in HD 85905. These phenomena motivated subsequent monitoring campaigns between 2022-2025, with the results presented in this paper.
3 Observations
3.1 Optical spectroscopy
The observations were obtained in different campaigns from 2012 to 2025 using the FIbred-fed Echelle Spectrograph (FIES) and the High Efficiency and Resolution Mercator Echelle Spectrograph (HERMES) instruments on the Nordic Optical Telescope (NOT) and Mercator telescope, respectively, both located at El Roque de los Muchachos Observatory in La Palma, Spain, and the Fiber-fed Extended Range Optical Spectrograph (FEROS) on the MPIA 2.2−m telescope at La Silla Observatory, Chile. The resolutions and wavelength ranges covered by each spectrograph are: R ∼ 67 000, Δ λ=3700−8300 Å (FIES), ∼ 85 000, 3770−9000 Å (HERMES), and ∼ 48 000, 3500−9200 Å (FEROS). Two archival spectra, obtained with Keck/HIRES (2012, see Table A.1 and Fig. A.2) were also added to our own observations and included in the analysis.
The spectra were reduced using the instruments’ pipelines and corrected from heliocentric velocity. Since this work focuses on the analysis of the circumstellar absorptions superimposed on the photospheric Ca II K line at 3933.66 Å, the removal of telluric lines was not necessary. The mean signal-to-noise ratios (S/Ns), which take into account all the spectra for each target, are 118 (HD 36546), 121 (HD 42111), and 95 (HD 85905). For the case of HD 85905 individual spectra with S/N<70 were not used in the analysis due to the complexity of the Ca II K line (see Sect. 5). However, in the first step described in Sect. 4, where a weighted mean spectrum is obtained, all available spectra were included. This selection criterion was not required for HD 36546 and HD 42111, as a smaller number of features were detected.
Table A.1 and Fig. A.2 provide a complete summary of the number of spectra obtained for each star, dates and instruments used (in addition to quantitative results discussed later in this work).
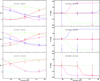 |
Fig. 1 Left: squared visibilities as a function of wavelength, obtained for the three observing blocks (three panels) and six baselines (depicted with six different symbols and colours), along with the best-fit binary model described in Sect. 5.2.1 (solid lines). Right: same as the left, but for the four closure phases obtained in each observing block. Some of the squared visibilities and closure phases are not displayed for the third observing block. They have not been used in this analysis, due to the poor data quality. |
3.2 Infrared interferometry
HD 85905 was observed on 8 April 2014 with the VLTI/PIONIER interferometer as part of the exozodiacal disk survey of Absil et al. (2021). The four 1.8 m Auxiliary Telescopes (ATs) were used in the D0-H0-G1-I1 array configuration featuring baselines ranging between 41 m and 82 m, producing six visibility and four closure phase measurements simultaneously. The PIONIER read-out mode was set to FOWLER with SMALL dispersion (three spectral channels). Four calibrator stars were selected from Mérand et al. (2005) within 10° on the sky to minimise the effects of pupil rotation or instrumental polarisation (see Le Bouquin & Absil 2012). Additional selection criteria included an H-band magnitude on a similar level to that of the science target, along with a small angular diameter, resulting in the following four calibrator stars: HD 83844 (CAL1), HD 84639 (CAL2), HD 86391 (CAL3), and HD 89338 (CAL4). All four are of the K0 III spectral type, with H-band magnitudes ranging from 5.4 to 5.9. The target was observed in a CAL1-SCI-CAL2-SCI-CAL3-SCI-CAL4 sequence, taking a total of about 1 h 15 m, under variable, yet decent atmospheric conditions: seeing ranging from 0.′′ 7 to 1′′.2, coherence time around 2.5 ms. The data reduction consists of the conversion of raw observations into calibrated interferometric observables (squared visibilities and closure phases). We used the exact same method as that presented in Ertel et al. (2014), where we calibrated each SCI of the CAL-SCI-...-CAL sequence individually by pairing it with either the preceding or the following CAL. The extracted squared visibilities and closure phases are displayed in Fig. 1.
While this observation was part of a larger survey, this dataset was not included in the related publication (Absil et al. 2021) because HD 85905 was immediately identified as a binary deserving a dedicated follow-up study, based on the strong visibility variations and closure phases observed in the PIONIER data. As part of our follow-up attempt, the target was observed again with PIONIER on 1 February 2018, but only one observing block was obtained in cloudy conditions. This dataset (of comparatively lower quality) does not bring useful information in the context of the present study (i.e. not enough for a proper orbital characterisation) and it is not further considered here.
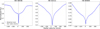 |
Fig. 2 Weighted mean profiles of the Ca II K absorption line of HD 36546, HD 42111, and HD 85905 using all the available spectra for each object. The circumstellar non-photospheric narrow components are demonstrably distinguishable from the photospheric absorptions. |
4 Methodology
To search for and analyse any possible variations in the circumstellar components, the weighted means of all the spectra were obtained by taking into account their S/N in the region of the Ca II K line. The S/N is defined as μ/σ, where μ is the arithmetic mean of the flux and σ is the standard deviation, both calculated in a 1−2 Å interval in the continuum close to the line. The weighted mean, x̄, is computed using the expression
 (1)
where
(1)
where  is the weight of the i-th spectrum. Figure 2 shows the weighted means of the Ca II K profiles computed using all the observations available for each object. The photospheric profile of x̄ for each star was fitted to a spline; each individual Ca II K profile was divided by the spline, the results being the circumstellar non-photospheric contributions normalised to intensity 1.0. The equivalent widths (EWs) and the uncertainties (δ EWs) of each circumstellar profile were computed using the expressions
 (2)
where Fλ is the line flux, Fc is the flux of the continuum, and the integration interval [λ1, λ2](Δ λ=λ2−λ1) brackets the non-photospheric component. The EWs of the circumstellar components were computed after dividing the full Ca II K profile of by a spline to get rid of the photospheric contribution of the line. The process is illustrated in Fig. 3. The uncertainties in the EWs have been computed using the comprehensive formalism described in Appendix 1 of the paper by Howarth & Phillips (1986) and implemented in the Starlink1 software dipso, which has been used in this work (in particular, for this task). The results for the EWs and the 2 σ uncertainties are given in Table A.1 and a graphical display of these data is provided in Fig. A.1.
(2)
where Fλ is the line flux, Fc is the flux of the continuum, and the integration interval [λ1, λ2](Δ λ=λ2−λ1) brackets the non-photospheric component. The EWs of the circumstellar components were computed after dividing the full Ca II K profile of by a spline to get rid of the photospheric contribution of the line. The process is illustrated in Fig. 3. The uncertainties in the EWs have been computed using the comprehensive formalism described in Appendix 1 of the paper by Howarth & Phillips (1986) and implemented in the Starlink1 software dipso, which has been used in this work (in particular, for this task). The results for the EWs and the 2 σ uncertainties are given in Table A.1 and a graphical display of these data is provided in Fig. A.1.
An estimate of the column density, N(Ca II), according to Eq. (1) in Somerville (1988) was computed as
 (3)
where EW and λ0 are the equivalent width and wavelength of the line (both of them in Å), and f12 is the oscillator strength of the transition; according to the NIST2 database, f12=0.682. This expression is only applicable to optically thin lines.
(3)
where EW and λ0 are the equivalent width and wavelength of the line (both of them in Å), and f12 is the oscillator strength of the transition; according to the NIST2 database, f12=0.682. This expression is only applicable to optically thin lines.
The Ca II column density could be translated into total mass by making some strong assumptions about the local chemistry, geometry, density distribution of the gas, and so on. The steps to carry out that estimate would be: (i) convert the column density N(Ca II) into N(Ca); (ii) compute the H abundance from the Ca abundance, so the hydrogen column density can be obtained; (iii) estimate the surface mass density; (iv) adopt a geometry; and (v) assume a gas-to-dust ratio. The main caveats potentially leading to large uncertainties would be: (a) the optical depth of the absorption, since Eq. (3) is only valid in the optically thin case; (b) the ionisation fraction ɛ (Ca II)/ɛ(Ca), where ɛ is the number particles, which is unknown; (c) the composition [Ca/H], which could be different from the stellar one; (d) the geometry or covering factor if the absorbing gas is clumpy or intercepts a small fraction of the star; and (e) the gas-to-dust ratio, which is usually taken as 100 for the ISM or protoplanetary disks, could not be applied to the case studied here. Given all these unknowns, we solely provide the values of the Ca II column densities in Table A.1, so that all variables involved can be explored and fixed according to the chosen hypotheses and scenarios.
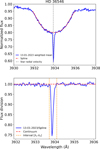 |
Fig. 3 Upper panel: weighted mean of the spectra of HD 36546, obtained on 13 Jan 2023, around the Ca II K line (blue), and the spline fitting the photospheric profile of the weighted mean spectrum built from all the available observations (red dashed line). The vertical grey dashed line marks the radial velocity of the star. Lower panel: ratio between the weighted mean spectrum from that date and the spline. The two vertical orange dashed lines mark the limits of the interval where the non-photospheric absorption is detected. |
Average parameters from the equivalent widths.
5 Results
5.1 General considerations
In the three stars studied here, a stable circumstellar component can be seen in all the spectra. These components do not vary their radial velocity and they are particularly conspicuous and narrow in HD 36546 and HD 85905, while being somewhat broader in HD 42111 (see Fig. 2). These components are located at the corresponding radial velocity of each star and, therefore, we assume they arise from a circumstellar disk or envelope. As we can see from Fig. 2, the weighted means of the circumstellar absorptions of HD 36546 and HD 85905 both show asymmetries in the red wing, although they are more noticeable in the latter.
Table 2 (top) shows the values of the equivalent widths of the circumstellar components of the Ca II K line obtained from the weighted average spectrum built for each object from the whole collection of individual spectra, along with the corresponding values of the column densities estimated from these equivalent widths. The flux variations of different degrees have been detected in the circumstellar Ca II K absorptions of the objects in analyses of the individual spectra; this is particularly noticeable for HD 85905. Equivalent widths of the circumstellar components and column densities were also computed for every date, averaging the spectra of each night (Table A.1), as no significant variations were observed on short timescales. The bottom half of Table 2 shows the values of the mean, median, and standard deviation of the equivalent widths derived from the set of individual spectra for each star. It is clear that the dispersion of values around the mean is substantially larger, in relative terms, for HD 85905. Figure 4 shows the spectra that exhibit the greatest variations with respect to the average spectra for each star.
5.2 HD 85905
The pronounced variability of HD 85905 motivated us to perform a dedicated analysis of this object. The observed variations are complex and appear to result from a combination of multiple components whose nature remains uncertain. In the following sections, we re-assess the stellar parameters according to the binary configuration of this object, discuss the results obtained from the spectral fittings and the spectral energy distribution (SED), and describe the variability patterns in detail.
5.2.1 Binarity
To confirm the presence of a stellar companion based on the PIONIER data, we used the squared visibilities (V2) and closure phases (CPs) in combination. As in Marion et al. (2014), we considered a binary star model with the primary at the centre of the search region and an off-axis companion of varying contrast at each point of the search region. In the present case, we can safely assume that both the primary and the secondary stars are unresolved, as our target star has an estimated angular diameter of about 0.22 mas based on surface brightness relationships (Kervella et al. 2004). We then computed the V2 and CP for each binary model and derived a combined goodness of fit that we normalised and collapsed along the contrast axis to keep only the best-fitting companion contrast (i.e. minimum χ2 value) at each position in the search region. The resulting χ2 map, displayed in Fig. 5, can then be used to derive the probability for the single-star model to adequately represent the data based on the χ2 distribution under a Gaussian noise assumption. With a normalised χ2 larger than 280, the single-star model can be rejected with a very high confidence.
While the χ2 map shows a series of local minima, only one position leads to a normalised χ2 lower than 5, so that the bestfit position can be considered to be unambiguous. The best-fit binary model is displayed as solid lines in Fig. 1, showing an excellent agreement with the data3. The binary fit then yields the following results: angular separation of 16.8 ± 0.3 mas, position angle of −54°.1 ± 0.5, and H-band contrast of 0.855 ± 0.076. Based on the derived angular separation and on the distance to the system, while assuming a circular face-on orbit, the semi-major axis would be about 2.6 au and the period around 2.2 years. From the results of the PIONIER observation alone, obtained in the H band, the companion could be slightly evolved (as in the case of the A1 IV primary) and, thus, it is likely to be of a similar spectral type; alternatively, if it were on the main sequence, it could be a star of spectral type ∼ B 4 V; this second possibility is inconsistent when the observed luminosity of the object is taken into account.
As supplementary information, it is interesting to note that data from Gaia DR2 and DR3 already provided some hints about the potential binarity. The re-normalised unit weight error (RUWE) parameter increased from 0.8653 (DR2) to 1.2976 (DR3). RUWE provides information about the astrometric deviation from using single-source solutions, the flag warning about potential ‘bad’ solutions having been set to 1.4 (DR2) and 1.25 (EDR3; Castro-Ginard et al. 2024). The values for the DR3 parameters ipd_gof_harmonic_phase (150), and ipd_frac_multi_peak (1), according to the Gaia DR3 documentation4, suggests that the combination of the two values would be consistent with the hypothesis of a binary scenario.
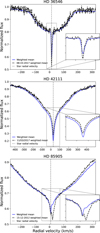 |
Fig. 4 Maximum variation in the circumstellar line profiles of the stars with respect to their corresponding mean spectrum. For HD 36546 and HD 42111, the insets in both panels show tiny differences between the circumstellar features. For HD 85905, there is a remarkable feature around 25 km/s, similar to those observed in Beust et al. (1990), making it compatible with the FEB scenario. |
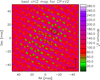 |
Fig. 5 Normalised χ2 map of the combined V2+CP analysis for the VLTI/PIONIER observation. The white star at the centre marks the (fixed) position of the primary star in the binary model, while the black circle indicates the position of the minimum in the map, i.e. the most likely position for the companion. |
5.2.2 Stellar parameters
In view of the results presented in the previous section, the spectroscopic determination by Rebollido et al. (2020), based on the assumption that the star was a single object (see Table 1), must obviously be revised. An interesting fact of both the spectroscopic and photometric analyses is that a single-temperature, single-gravity model provides a set of parameters that is apparently self-consistent, with no hint that a combination of two different stellar models would be required to fit the spectrum and the SED. However, the luminosity, L*/L⊙=112.6 ± 10.0, computed by the integration of the de-reddened best-fitting model, using the distance from the Gaia DR3 parallax, ϖ=5.4555 ± 0.0433 mas, does not correspond to that of a single star of spectral type A1 IV located at that distance, but to a much brighter object5 (see Appendix B for details).
A solution, congruent with the possibility suggested by the PIONIER observation (i.e. that of an almost-identical component binary) would be to consider that the binary is made of two coeval objects of similar spectral types. The total luminosity, resulting of adding up the individual values, would match the observed one, with both stars being slightly off the main sequence with parameters consistent with the observed spectral type A1 IV.
We explored the parameter space for solutions with temperatures around and close to 9040 K (i.e. the temperature determined from the spectroscopic analysis), using the data contained in the PARSEC 2.1s evolutionary tracks and isochrones6 (Bressan et al. 2012). The best result can be found in the sets of parameters given in Table 3, fulfilling the constraints: (i) both stars have temperatures close to that of the one-temperature fit; (ii) the sum of their luminosities matches the observed one; (iii) the contrast between the fluxes in the H band is 0.855; and (iv) the stars are coeval. Figure B.1 shows in the top panels the HR diagrams luminosity-temperature and gravity-temperature with the putative the position of the star according to the onetemperature fit (red dot) and the locations proposed for the two-component solution, labelled C1 and C2. In the bottom panel, the two Kurucz synthetic models are given, reddened with AV=0.237 and with their sum plotted in green (C1), magenta (C2), and grey (C1+C2), together with the observed photometry, HST/STIS spectrum, and IUE spectrum SWP 34794 extracted from the INES database7.
Parameters for the HD 85905 binary solution.
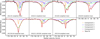 |
Fig. 6 Gaussian fits to the circumstellar components of the Ca II K line for HD 85905. The observed profiles, plotted in black are the result of dividing the corresponding weighted mean spectra and the photospheric profile. Four Gaussian curves have been fitted to each profile, with the results of the fits after the addition of the four Gaussians plotted in red. The orange component does not vary significantly through the different epochs. |
5.2.3 Variability
The circumstellar profiles for most epochs can be fitted with a minimum of four Gaussian components. Figure 6 shows the mean circumstellar profiles, plotted in black, of seven epochs in the interval 2012–2025, with the different components separated by colours and their combination plotted in red. Table 4 gives the depth, A, position, μ, and standard deviation, σ, of the individual components. Throughout the observed spectra, dramatic variations are apparent, with a stable component present in all epochs, plotted in orange (labelled ‘component 1’), which remains roughly constant in EW, depth, radial velocity, and width. Other transient components appear and disappear both blue and redshifted with respect to the radial velocity of the star, following a complex pattern. The depth of component 1 has been kept constant, allowing for the remaining of that component to vary. The mean values for the position and standard deviation are μ1=8.23 ± 0.38 km/s and σ1=3.08 ± 0.30 km/s, respectively.
Figure A.2 shows the circumstellar components of the Ca II K line for HD 85905 in multiple epochs in greater detail. The panel on the left shows spectra extracted from papers and scanned: 1987/05 (Lagrange-Henri et al. 1990), 1997/01 and 1997/11 (Welsh et al. 1998). Those from 2004/12 and 2005/02 are archival observations (Redfield et al. 2007). These spectra are shown for comparison and have not been used in the analysis carried out in this paper. The three panels on the right show the circumstellar profiles of observations obtained in the period 2012–2025. Red and blue labels in Fig. A.2 alternate to separate observations of different campaigns and to help to make comparisons among the differences between consecutive runs. In addition to the dates, the spectrographs used are specified in the labels. The depths, widths, and global shapes of the circumstellar component vary without any apparent pattern. The stable component at ∼ 8.23 km/s is the only feature that remains roughly unchanged, whereas around 25 km/s, there is a feature that appears and disappears in an unpredictable way.
Figure 7 shows an example of the variability of HD 85905 on a daily timescale. The plot shows the mean of four sets of spectra obtained in intervals of ∼ 2.5 h during four consecutive nights. The stable component of the circumstellar absorption at ∼ 8.23 km/s appears unchanged, whereas a component at ∼ 23 km/s shows a clear variation. The red vertical line in the figure connects the maximum depth of the variable feature observed in each spectra, spanning from 14 to 16 km/s in the stellar reference frame and suggesting a mild acceleration of the gas responsible for this component.
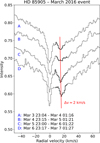 |
Fig. 7 Example of variability in the circumstellar Ca II K component of HD 85905 on timescales of days. The plot shows the weighted mean of spectra obtained close in time at the beginning of four consecutive nights starting around UT 23:00 on 3–6 March 2016, with 4, 4, 3, and 3 spectra contributing to the respective means. Variability in the component at ∼ 23 km/s is clearly visible; its minima, joined by a red line, are redshifted by ∼ 2 km/s from spectrum A to D, hinting to a mild acceleration of the clump of gas producing that absorption. |
6 Discussion
Detecting exocometary phenomena through spectroscopic monitoring is inherently challenging. In addition to requiring high-resolution, high-S/N ratio spectra, it also demands a temporal cadence that is (with few exceptions) difficult to achieve. A good example of a successful monitoring is that for β Pic (Kennedy 2018) where subtle exocometary events (see Fig. 4 of that paper) were detected and studied in depth; in particular, the one on MJD=54913 required the analysis of 61 HARPS spectra obtained during an interval of just 2 hours. Such an optimal time-intensive strategy, feasible for that object given its brightness and the well-known high exocometary activity, is risky for other exocomet-host candidates, as the transient nature of these events implies a high likelihood of potential non-detections.
While all three target stars in this paper (HD 36546, HD 42111, and HD 85905) have been classified in the past as exocomet host stars, the variations detected for HD 36546 and HD 42111 in the set of spectroscopic observations studied in this paper are very small. In the case of HD 36546, the shape of the absorption had already been reported as asymmetric (Rebollido et al. 2020), with previous variations observed redshifted with respect to the radial velocity of the star, consistent with an exocometary origin. The variations observed here are mostly related to the depth of the circumstellar component, and only within a few per cent of the EW of the average spectra. HD 42111 is a known shell star (Grady et al. 1996) that had previously shown low velocity variations in the circumstellar absorption (Welsh & Montgomery 2013). However, the variations observed in this work are, as in the case of HD 36546, very small (see Table 2). Ultimately, there is no further evidence of exocomet-like variability for either of these stars.
Regarding HD 85905, both from this work and previous results in the literature, the extreme variability spotted in the circumstellar Ca II K component in time scales of days, weeks, and months, qualitatively consistent in some aspects with the FEB scenario, cannot be entirely attributed, beyond any doubt, to exocometary activity, considering the discovery that the star is actually a binary. This scenario would be consistent with reported binarity fractions for A-type stars. According to Duchêne & Kraus (2013), the multiplicity fraction of main sequence early type stars should be above 50−60%, reaching almost 80% for B-type stars.
To ascertain the role of binarity in the variable circumstellar features of HD 85905, there are many open questions regarding its architecture that can only be answered after an intensive spectroscopic monitoring of the star and further interferometric observations to characterise the orbit. Figure 8 shows the photospheric profiles of the Ca II K line from the weighted mean spectra for 2015 and 2017, with the corresponding circumstellar components superimposed at the bottom. The width and shape of the photospheric line in both epochs are virtually the same, whereas if the minima observed in the 2015 spectrum are interpreted as arising from the two different components of the binary system (one from each star), then appreciable changes in the profile width would be expected between the 2015 and 2017 spectra, which is not the case here. We also note that this behaviour is shared by all photospheric lines. The observation that the stable circumstellar component does not change its position and it is always centred at the same radial velocity could indicate that it has originated in a circumbinary disk.
The fact that the shape and width of the photospheric Ca II K line seem to remain stable could be explained by claiming that the orbit is actually face-on. However, this seems to be quite unlikely, as the width of the photospheric Ca II K profile at half intensity is around 460 km/s; this implies a value of v sin i ≃ 285 km/s to reproduce not only the width of this line, but also the profiles of other photospheric features when a single- T, singlelog g fit is carried out to fit the observed spectrum (Rebollido et al. 2020). If the inclination of the orbit were small (and assuming that that rotation axes of the stars are perpendicular to the plane of the orbit) such a value of v sin i would be totally unrealistic. Discarding the hypothesis of a low inclination for the orbit, a substantial difference between the projected rotational speeds, with the spectrum dominated by the fast rotator, could help explain this behaviour of the spectrum.
Additional hypotheses should be assessed in order to confirm or discard the potential exocometary origin of the variability observed in HD 85905. In addition to the results of the photometric analysis, the variability in the position and depth of the circumstellar components and, in particular, the appearance and disappearance of the component redwards of the stable component could be compatible with its origin being located closer to the companion, in a configuration that is qualitatively similar to that in HR 10 (Montesinos et al. 2019). We note, of course, that this does not rule out the possibility that the origin be linked to the primary component of the binary. Despite the fairly large number of spectra collected, the irregular separations between campaigns does not allow for any meaningful information to be extracted, for the purposes of building a radial velocity curve.
Another possibility can include pulsation modes of the star altering its circumstellar environment. This has been observed in the case of shell stars (Eiroa et al. 2021). However, this explanation was discarded as there is no evidence of variability in other photospheric features, such as the Balmer lines. The significant variability observed also rules out the possibility of an ISM origin for the non-photospheric absorptions.
Since all variable features observed are not explained by circumstellar gas around both components of the binary, the potential presence of exocomets around HD 85905 cannot be discarded. Figure 7 shows four mean spectra of the Ca II K line obtained during approximately 2 hours at the beginning of four consecutive nights on 3–6 March 2016; the slight shift to the red, Δ v ≃ 2 km/s in 4 days, of the component at ∼ 23 km/s could suggest a mild acceleration of the absorbing gas. This can be compared with the results obtained by Kennedy (2018) for β Pic, although it could also be related with the orbital motion of the binary. However, as we point out above, testing the exocomet hypothesis is very challenging due to the sporadic nature of these events, particularly before the orbit of the binary is properly parametrised, and, therefore, more data will be necessary. For instance, there are no reported detections of variable gas in UV wavelengths or sub-mm observations that could point to high-velocity exocomets (Kiefer et al. 2014b; Vrignaud et al. 2025). Photometric time series could also help confirm this scenario, although the data obtained by TESS, while publicly available, remain unpublished and their analysis is out of the scope of this work.
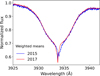 |
Fig. 8 Full photospheric profiles of the Ca II K line, with the corresponding circumstellar absorptions at the bottom, extracted from the weighted mean spectra of HD 85905 corresponding to the 2015 and 2017 campaigns. No differences are observed in the width and shape of the lines. |
7 Conclusions
We present high-resolution observations of two main sequence stars and a subgiant star, with the aim of detecting exocometary-like features. All three objects in this study have shown in the past circumstellar features with different degrees of variability, which imply that changes have occurred in the material surrounding the objects. Two objects, HD 36546 and HD 42111, do not show significant variations in the sets of observations studied in this paper, whereas HD 85905 presents signatures that resemble those of the β Pic absorptions, as described in Ferlet et al. (1987). Figure A.2 shows that the variations seem to take place more frequently at a redshifted position relative to the star radial velocity, although some sporadic (albeit intense) episodes have also been detected at blue wavelengths. The explanation of the variability of this star is a question that remains open. The fact that HD 85905 is a binary makes the problem even more complex because the question we need to answer is whether the variable circumstellar absorptions observed in this object (along with the peculiar behaviour of its spectra) can be attributed to the binary orbit alone or whether they are exocometary in origin.
The hypothesis of the existence of cometary material around the three stars, and particularly around HD 85905, is not yet firm because there is the possibility that the circumstellar absorptions might be due to dust grain evaporation and/or grain-grain collisions in a disk or envelope. Intensive, well-sampled systematic observations on a range of timescales are required to confirm or dismiss the presence of exocomets close to these stars.
Acknowledgements
We thank the referee for the constructive report, and the suggestions and comments, which have undoubtedly contributed to improving the original manuscript. We are grateful to Prof. Seth Redfield (Wesleyan University, USA) for providing the spectra of HD 85905 obtained with the McD2. 7 telescope in 2004 and 2005, and to Dr Jesús Maíz-Apellániz (CAB, CSIC-INTA) for observing the star with Mercator/HERMES in April 2025. We are also grateful to Dr Héctor Canovas for helping us with the interpretation of some Gaia parameters for HD 85905. We would like to thank Sergio Suárez and Antonio Parras for their ongoing assistance, availability, kindness, and impeccable maintenance of the CAB’s computer system. B. M. and I. R. acknowledge the funding by grant PID2021-127289-NB-I00 from MCIN/AEI/10.13039/501100011033/ and FEDER. P. M.-C. acknowledges the funding by grant PID2022-137980NB-I00. P. C. acknowledges financial support from the Spanish Ministry of Science and Innovation/State Agency of Research MCIN/AEI/10.13039/501100011033 through the Spanish Virtual Observatory project PID2023-146210NB-I00. S.E. is supported by NASA through grants 80NSSC21K0394, 80NSSC23K1473, and 80NSSC23K0288. This publication makes use of VOSA, developed under the Spanish Virtual Observatory (https://svo.cab.inta-csic.es) project funded by MCIN/AEI/10.13039/501100011033/ through grant PID2020-112949GB-I00. VOSA has been partially updated by using funding from the European Union’s Horizon 2020 Research and Innovation Programme, under Grant Agreement no. 776403 (EXOPLANETS-A). This research has made use of the SIMBAD database, operated at CDS, Strasbourg, France; and also of Starlink software (Currie et al. 2014), currently supported by the East Asian Observatory.
References
- Absil, O., Marion, L., Ertel, S., et al. 2021, A&A, 651, A45 [NASA ADS] [CrossRef] [EDP Sciences] [Google Scholar]
- Aller, L. H., Appenzeller, I., Baschek, B., et al., 1982, Landolt-Börnstein: Numerical Data and Functional Relationships in Science and Technology – New Series, Group 6 Astronomy and Astrophysics, 2 (Berlin Heidelberg New York: Springer-Verlag) [Google Scholar]
- Bayo, A., Rodrigo, C., Barrado Y Navascués, D., et al. 2008, A&A, 492, 277 [NASA ADS] [CrossRef] [EDP Sciences] [Google Scholar]
- Beust, H., Lagrange-Henri, A. M., Vidal-Madjar, A., & Ferlet, R., 1990, A&A, 236, 202 [NASA ADS] [Google Scholar]
- Bressan, A., Marigo, P., Girardi, L., et al. 2012, MNRAS, 427, 127 [NASA ADS] [CrossRef] [Google Scholar]
- Cao, D., Plavchan, P., & Summers, M., 2024, ApJ, 971, 160 [Google Scholar]
- Castelli, F., & Kurucz, R. L., 2003, in IAU Symposium, 210, Modelling of Stellar Atmospheres, eds. N. Piskunov, W. W. Weiss, & D. F., Gray, A20 [NASA ADS] [Google Scholar]
- Castro-Ginard, A., Penoyre, Z., Casey, A. R., et al. 2024, A&A, 688, A1 [NASA ADS] [CrossRef] [EDP Sciences] [Google Scholar]
- Currie, M. J., Berry, D. S., Jenness, T., et al. 2014, in Astronomical Society of the Pacific Conference Series, 485, Astronomical Data Analysis Software and Systems XXIII, eds. N. Manset, & P. Forshay, 391 [Google Scholar]
- Currie, T., Guyon, O., Tamura, M., et al. 2017, ApJ, 836, L15 [NASA ADS] [CrossRef] [Google Scholar]
- de Val-Borro, M., Bockelée-Morvan, D., Jehin, E., et al. 2014, A&A, 564, A124 [NASA ADS] [CrossRef] [EDP Sciences] [Google Scholar]
- Dones, L., Weissman, P. R., Levison, H. F., & Duncan, M. J., 2004, in Comets II, eds. M. C. Festou, H. U. Keller, & H. A. Weaver (Tucson, Arizona: The University of Arizona Press), 153 [Google Scholar]
- Duchêne, G., & Kraus, A., 2013, ARA&A, 51, 269 [Google Scholar]
- Dumond, P., Lecavelier des Etangs, A., Kiefer, F., Hébrard, G., & Caillé, V. 2025, A&A, 704, A191 [NASA ADS] [CrossRef] [EDP Sciences] [Google Scholar]
- Eiroa, C., Montesinos, B., Rebollido, I., et al. 2021, A&A, 653, A115 [NASA ADS] [CrossRef] [EDP Sciences] [Google Scholar]
- Ertel, S., Absil, O., Defrère, D., et al. 2014, A&A, 570, A128 [NASA ADS] [CrossRef] [EDP Sciences] [Google Scholar]
- Ferlet, R., Hobbs, L. M., & Vidal-Madjar, A., 1987, A&A, 185, 267 [NASA ADS] [Google Scholar]
- Grady, C. A., Perez, M. R., & Talavera, A., 1996, in American Astronomical Society Meeting Abstracts, 185, 48.07 [Google Scholar]
- Hobbs, L. M., Vidal-Madjar, A., Ferlet, R., Albert, C. E., & Gry, C., 1985, ApJ, 293, L29 [NASA ADS] [CrossRef] [Google Scholar]
- Høg, E., Fabricius, C., Makarov, V. V., et al. 2000, A&A, 355, L27 [Google Scholar]
- Howarth, I. D., & Phillips, A. P., 1986, MNRAS, 222, 809 [NASA ADS] [Google Scholar]
- Kennedy, G. M., 2018, MNRAS, 479, 1997 [NASA ADS] [CrossRef] [Google Scholar]
- Kervella, P., Thévenin, F., Di Folco, E., & Ségransan, D., 2004, A&A, 426, 297 [NASA ADS] [CrossRef] [EDP Sciences] [Google Scholar]
- Kiefer, F., Lecavelier Des Etangs, A., Boissier, J., et al. 2014b, Nature, 514, 462 [NASA ADS] [CrossRef] [Google Scholar]
- Kiefer, F., Van Grootel, V., Lecavelier des Etangs, A., et al. 2023, A&A, 671, A25 [NASA ADS] [CrossRef] [EDP Sciences] [Google Scholar]
- Kral, Q., Matrà, L., Kennedy, G. M., Marino, S., & Wyatt, M. C., 2020, MNRAS, 497, 2811 [NASA ADS] [CrossRef] [Google Scholar]
- Lagrange-Henri, A. M., Ferlet, R., Vidal-Madjar, A., et al. 1990, A&AS, 85, 1089 [Google Scholar]
- Lawson, K., Currie, T., Wisniewski, J. P., et al. 2021, AJ, 162, 293 [CrossRef] [Google Scholar]
- Le Bouquin, J. B., & Absil, O., 2012, A&A, 541, A89 [NASA ADS] [CrossRef] [EDP Sciences] [Google Scholar]
- Lecavelier des Etangs, A., Cros, L., Hébrard, G., et al. 2022, Sci. Rep., 12, 5855 [NASA ADS] [CrossRef] [Google Scholar]
- Lis, D. C., Bockelée-Morvan, D., Güsten, R., et al. 2019, A&A, 625, L5 [NASA ADS] [CrossRef] [EDP Sciences] [Google Scholar]
- Lisse, C. M., Sitko, M. L., Russell, R. W., et al. 2017, ApJ, 840, L20 [Google Scholar]
- Marino, S., Matrà, L., Stark, C., et al. 2016, MNRAS, 460, 2933 [Google Scholar]
- Marion, L., Absil, O., Ertel, S., et al. 2014, A&A, 570, A127 [NASA ADS] [CrossRef] [EDP Sciences] [Google Scholar]
- Mérand, A., Bordé, P., & Coudé du Foresto, V. 2005, A&A, 433, 1155 [Google Scholar]
- Montesinos, B., Eiroa, C., Lillo-Box, J., et al. 2019, A&A, 629, A19 [NASA ADS] [CrossRef] [EDP Sciences] [Google Scholar]
- Moór, A., Ábrahám, P., Kóspál, Á., et al. 2025, A&A, 703, A15 [NASA ADS] [CrossRef] [EDP Sciences] [Google Scholar]
- Norazman, A., Kennedy, G. M., Cody, A. M., et al. 2025, MNRAS, 542, 1486 [Google Scholar]
- Pavlenko, Y., Kulyk, I., Shubina, O., et al. 2022, A&A, 660, A49 [NASA ADS] [CrossRef] [EDP Sciences] [Google Scholar]
- Rebollido, I., Eiroa, C., Montesinos, B., et al. 2020, A&A, 639, A11 [EDP Sciences] [Google Scholar]
- Rebollido, I., Ribas, Á., de Gregorio-Monsalvo, I., et al. 2022, MNRAS, 509, 693 [Google Scholar]
- Redfield, S., Kessler-Silacci, J. E., & Cieza, L. A., 2007, ApJ, 661, 944 [Google Scholar]
- Rodrigo, C., Cruz, P., Aguilar, J. F., et al. 2024, A&A, 689, A93 [NASA ADS] [CrossRef] [EDP Sciences] [Google Scholar]
- Somerville, W. B., 1988, The Observatory, 108, 44 [NASA ADS] [Google Scholar]
- Strøm, P. A., Bodewits, D., Knight, M. M., et al. 2020, PASP, 132, 101001 [Google Scholar]
- Vrignaud, T., Lecavelier des Etangs, A., Strøm, P. A., & Kiefer, F. 2025, A&A, 697, A21 [NASA ADS] [CrossRef] [EDP Sciences] [Google Scholar]
- Welsh, B. Y., & Montgomery, S., 2013, PASP, 125, 759 [NASA ADS] [CrossRef] [Google Scholar]
- Welsh, B. Y., Craig, N., Crawford, I. A., & Price, R. J., 1998, A&A, 338, 674 [NASA ADS] [Google Scholar]
- Worthen, K., Chen, C. H., Brittain, S. D., et al. 2024, ApJ, 962, 166 [Google Scholar]
- Zieba, S., Zwintz, K., Kenworthy, M. A., & Kennedy, G. M., 2019, A&A, 625, L13 [NASA ADS] [CrossRef] [EDP Sciences] [Google Scholar]
In some cases, the binary model seems not to reproduce the measured CP, but this is due to the 180° wrapping in CP measurements, which also explains the very large error bars on some CP.
https://gea.esac.esa.int/archive/documentation/GDR3/Gaia_archive/, Chapter 20, section 20.1.1.
The error bar assigned to the luminosity is a conservative estimate accounting for the small uncertainty introduced by the parallax and the normalisation of the model to the observed SED.
The STIS spectrum was obtained within the program corresponding to HST proposal 9431, cycle 11, PI Alain Lecavelier des Etangs.
SpecPhot is available at https://svo2.cab.inta-csic.es/theory/specphot/index.php.
See eqns. 2.2.1 and 2.2.2 in https://cdsarc.u-strasbg.fr/ftp/cats/more/HIP/cdroms/docs/vol1//sect2_02.pdf
Appendix A Data
Results from the non-photospheric Ca II K components.
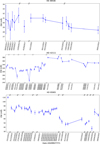 |
Fig. A.1 Variation among the equivalent widths of the circumstellar absorptions in the Ca II K line with time. Data in these panels correspond to those given in Table A.1. |
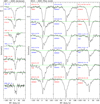 |
Fig. A.2 Circumstellar components of the Ca II K line for HD 85905 in multiple epochs. The panel on the left shows spectra scanned from papers (1987/05, 1997/01, and 1997/11) and archival data (2004 and 2005) obtained with the instruments CS21 and CS23 on the Harlan J. Smith 2.7m Telescope at McDonald Observatory (see text for details and references about all these observations). The three panels on the right show the circumstellar profiles of observations obtained in the period 2012–2025 which have been used to derive the results shown in Table A.1. Red and blue labels alternate to separate observations of different campaigns, this helps to make comparisons of the differences between profiles observed in runs separated months or years. In addition to the dates, the spectrographs used are specified in the labels. The data in the panel on the left are shown just for comparison with later spectra, and have not been used in the analysis carried out in this paper. |
Appendix B HD 85905: photometry, SED fitting, and HR diagrams
Appendix B.1 Photometry
The Virtual Observatory SED Analyzer (VOSA; Bayo et al. 2008) was used to collect the photometry across a wide spectral range and fit the SED of HD 85905. Table B.1 shows the optical, near-, and mid-IR photometric data converted into fluxes, with the corresponding uncertainties, collected by VOSA. Synthetic photometry, performed over a STIS/HST spectrum8, was generated using the SpecPhot9 application (Rodrigo et al. 2024) and it was also added to the available photometric data.
Regarding the optical photometry, which is important to estimate the brightness of the object, SIMBAD lists the following values: B=6.270 ± 0.014, V=6.213 ± 0.010, and gives as a reference the Tycho-2 catalogue (Høg et al. 2000), which does not list the Johnson magnitudes, but the Tycho BT=6.291 ± 0.014, VT=6.221 ± 0.010 magnitudes instead; these can be transformed into the Johnson-Cousins system using the following expressions,10
 (B.1)
which yield V=6.215 ± 0.011, B=6.274 ± 0.011, B−V=0.059 ± 0.015.
(B.1)
which yield V=6.215 ± 0.011, B=6.274 ± 0.011, B−V=0.059 ± 0.015.
On the other hand, the VizieR catalogue II/168/ubvmeans11, which lists the Johnson magnitudes between 5000 and 6000 Å (sic), gives V=6.233 ± 0.005, B−V=0.040 ± 0.005. An average of the two sets of values has been adopted as weighted means with inverse-variance weights, namely, B=6.273 ± 0.005, V=6.230 ± 0.005, B−V=0.043 ± 0.006.
Appendix B.2 SED fitting
VOSA was used to fit the SED of HD 85905. Among the collection of theoretical spectra available in that tool, Kurucz NEWODF models with no overshooting and α=0.0 (Castelli & Kurucz 2003) were selected. The value AV=0.237 (Gaia DR3) was used, and solar metallicity was assumed. The best fit was achieved for Teff=9000 K and log g=4.00, a temperature very close to that result (9040 K) found by Rebollido et al. (2020). We note (as mentioned in Sect. 5.2.2) that the analysis showed no indication that two models, potentially representative of the two components of the binary, were needed for the photometric fit, as was the case with the spectroscopic analysis. This fact is an important piece of information, as it suggests the binary could be composed of an almost-equal pair of stars.
In addition to the PIONIER observation, binarity was also supported by the inconsistency between the luminosity provided by the photometric fit and the brightness derived from the optical photometry. Correcting for reddening with AV=0.237 (Gaia DR3), the intrinsic values of the V magnitude and the B−V colour are V0=5.993,(B−V)0=−0.033, and using the distance modulus, the absolute magnitude is MV=−0.323: this value does not correspond to that of a single star of spectral type A1 IV, the one listed in the SIMBAD database. According to the Schmidt-Käler compilation of standard data for stars (Aller et al. 1982, eds), an object with Teff ≃ 9000 K in the main sequence would have typical MV and Lbol of ∼+1.2 and ∼ 30 L⊙, whereas the values for a giant with the same temperature would be ∼+0.3 and ∼ 65 L⊙, respectively. We note that given the difficulty of finding these tables online, an excerpt with the relevant data for luminosity classes V and III is given in Table B.2. Both luminosity values are well below that inferred for HD 85905 from the SED analysis. On the other hand, the value of the (B−V)0=−0.033 is slightly bluer than that corresponding to a ∼ 9000 K object. In the analysis described in Sect. 5.2.2, the temperature T=9040 K from the spectroscopic analysis was adopted as the reference to carry out the derivation of the parameters of both components of the binary described in Sect. 5.2.2.
HD 85905: Photometry.
Data for standard stars.
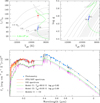 |
Fig. B.1 Upper panels: HR diagrams. The luminosity 112.6 L⊙, plotted as a red dot on the L*/L⊙−Teff HR diagram, was derived by integrating a single-temperature (1T) dereddened model with Teff=9040 K, which also fits the SED giving a value of the total flux, F*. The Gaia DR3 parallax and the expression L*=4 π d2 F* allowed us to compute the luminosity. The two blue dots in both diagrams correspond to parameters consistent with the binary scenario where the SED is reproduced by models for two coeval stars with parameters (Teff, log g) (9010 K, 3.82) (9105 K, 3.89), for components 1 and 2 (labelled C1 and C2), respectively, whose luminosities add up to the total luminosity of 112.6 L⊙. PARSEC 2.1s tracks and isochrones were used in this analysis. Lower panels: Observed photometry (blue dots), STIS/HST and IUE spectra of HD 85905 (red and orange lines, respectively), and the Kurucz photospheric models for components C1 and C2 built with the parameters shown in the legend, reddened with AV=0.237. The models fulfil the observational constraint of a contrast in the flux in the H band of 0.855 ± 0.076 from the PIONIER data (see text for details). |
All Tables
All Figures
|
Fig. 1 Left: squared visibilities as a function of wavelength, obtained for the three observing blocks (three panels) and six baselines (depicted with six different symbols and colours), along with the best-fit binary model described in Sect. 5.2.1 (solid lines). Right: same as the left, but for the four closure phases obtained in each observing block. Some of the squared visibilities and closure phases are not displayed for the third observing block. They have not been used in this analysis, due to the poor data quality. |
| In the text | |
|
Fig. 2 Weighted mean profiles of the Ca II K absorption line of HD 36546, HD 42111, and HD 85905 using all the available spectra for each object. The circumstellar non-photospheric narrow components are demonstrably distinguishable from the photospheric absorptions. |
| In the text | |
|
Fig. 3 Upper panel: weighted mean of the spectra of HD 36546, obtained on 13 Jan 2023, around the Ca II K line (blue), and the spline fitting the photospheric profile of the weighted mean spectrum built from all the available observations (red dashed line). The vertical grey dashed line marks the radial velocity of the star. Lower panel: ratio between the weighted mean spectrum from that date and the spline. The two vertical orange dashed lines mark the limits of the interval where the non-photospheric absorption is detected. |
| In the text | |
|
Fig. 4 Maximum variation in the circumstellar line profiles of the stars with respect to their corresponding mean spectrum. For HD 36546 and HD 42111, the insets in both panels show tiny differences between the circumstellar features. For HD 85905, there is a remarkable feature around 25 km/s, similar to those observed in Beust et al. (1990), making it compatible with the FEB scenario. |
| In the text | |
|
Fig. 5 Normalised χ2 map of the combined V2+CP analysis for the VLTI/PIONIER observation. The white star at the centre marks the (fixed) position of the primary star in the binary model, while the black circle indicates the position of the minimum in the map, i.e. the most likely position for the companion. |
| In the text | |
|
Fig. 6 Gaussian fits to the circumstellar components of the Ca II K line for HD 85905. The observed profiles, plotted in black are the result of dividing the corresponding weighted mean spectra and the photospheric profile. Four Gaussian curves have been fitted to each profile, with the results of the fits after the addition of the four Gaussians plotted in red. The orange component does not vary significantly through the different epochs. |
| In the text | |
|
Fig. 7 Example of variability in the circumstellar Ca II K component of HD 85905 on timescales of days. The plot shows the weighted mean of spectra obtained close in time at the beginning of four consecutive nights starting around UT 23:00 on 3–6 March 2016, with 4, 4, 3, and 3 spectra contributing to the respective means. Variability in the component at ∼ 23 km/s is clearly visible; its minima, joined by a red line, are redshifted by ∼ 2 km/s from spectrum A to D, hinting to a mild acceleration of the clump of gas producing that absorption. |
| In the text | |
|
Fig. 8 Full photospheric profiles of the Ca II K line, with the corresponding circumstellar absorptions at the bottom, extracted from the weighted mean spectra of HD 85905 corresponding to the 2015 and 2017 campaigns. No differences are observed in the width and shape of the lines. |
| In the text | |
|
Fig. A.1 Variation among the equivalent widths of the circumstellar absorptions in the Ca II K line with time. Data in these panels correspond to those given in Table A.1. |
| In the text | |
|
Fig. A.2 Circumstellar components of the Ca II K line for HD 85905 in multiple epochs. The panel on the left shows spectra scanned from papers (1987/05, 1997/01, and 1997/11) and archival data (2004 and 2005) obtained with the instruments CS21 and CS23 on the Harlan J. Smith 2.7m Telescope at McDonald Observatory (see text for details and references about all these observations). The three panels on the right show the circumstellar profiles of observations obtained in the period 2012–2025 which have been used to derive the results shown in Table A.1. Red and blue labels alternate to separate observations of different campaigns, this helps to make comparisons of the differences between profiles observed in runs separated months or years. In addition to the dates, the spectrographs used are specified in the labels. The data in the panel on the left are shown just for comparison with later spectra, and have not been used in the analysis carried out in this paper. |
| In the text | |
|
Fig. B.1 Upper panels: HR diagrams. The luminosity 112.6 L⊙, plotted as a red dot on the L*/L⊙−Teff HR diagram, was derived by integrating a single-temperature (1T) dereddened model with Teff=9040 K, which also fits the SED giving a value of the total flux, F*. The Gaia DR3 parallax and the expression L*=4 π d2 F* allowed us to compute the luminosity. The two blue dots in both diagrams correspond to parameters consistent with the binary scenario where the SED is reproduced by models for two coeval stars with parameters (Teff, log g) (9010 K, 3.82) (9105 K, 3.89), for components 1 and 2 (labelled C1 and C2), respectively, whose luminosities add up to the total luminosity of 112.6 L⊙. PARSEC 2.1s tracks and isochrones were used in this analysis. Lower panels: Observed photometry (blue dots), STIS/HST and IUE spectra of HD 85905 (red and orange lines, respectively), and the Kurucz photospheric models for components C1 and C2 built with the parameters shown in the legend, reddened with AV=0.237. The models fulfil the observational constraint of a contrast in the flux in the H band of 0.855 ± 0.076 from the PIONIER data (see text for details). |
| In the text | |
Current usage metrics show cumulative count of Article Views (full-text article views including HTML views, PDF and ePub downloads, according to the available data) and Abstracts Views on Vision4Press platform.
Data correspond to usage on the plateform after 2015. The current usage metrics is available 48-96 hours after online publication and is updated daily on week days.
Initial download of the metrics may take a while.