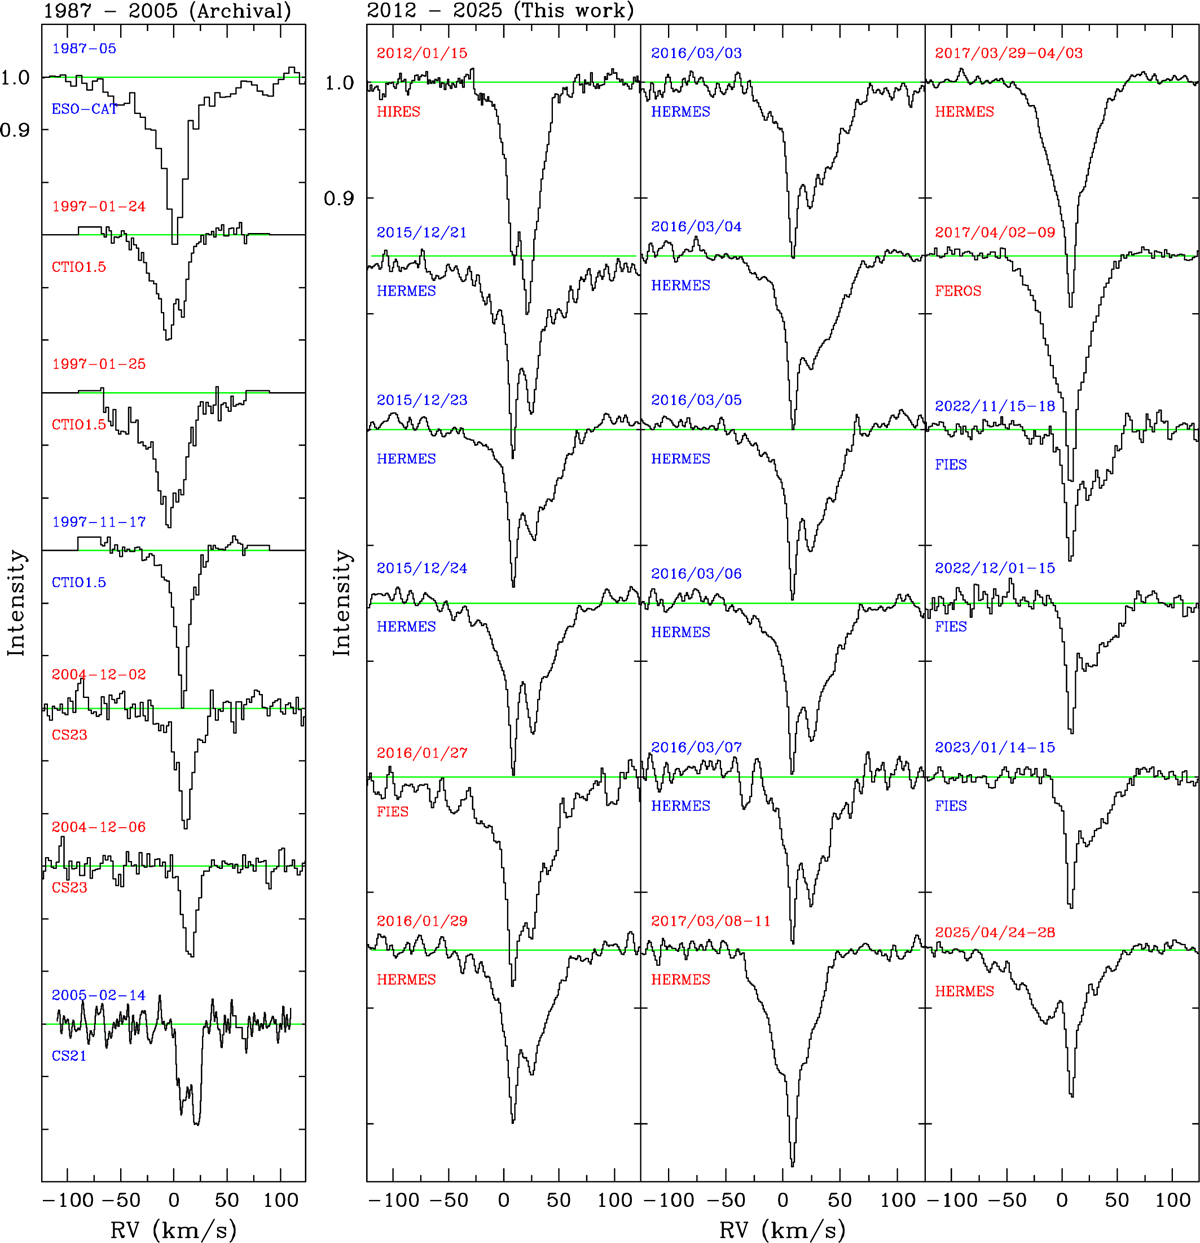
Fig. A.2
Download original image
Circumstellar components of the Ca II K line for HD 85905 in multiple epochs. The panel on the left shows spectra scanned from papers (1987/05, 1997/01, and 1997/11) and archival data (2004 and 2005) obtained with the instruments CS21 and CS23 on the Harlan J. Smith 2.7m Telescope at McDonald Observatory (see text for details and references about all these observations). The three panels on the right show the circumstellar profiles of observations obtained in the period 2012–2025 which have been used to derive the results shown in Table A.1. Red and blue labels alternate to separate observations of different campaigns, this helps to make comparisons of the differences between profiles observed in runs separated months or years. In addition to the dates, the spectrographs used are specified in the labels. The data in the panel on the left are shown just for comparison with later spectra, and have not been used in the analysis carried out in this paper.
Current usage metrics show cumulative count of Article Views (full-text article views including HTML views, PDF and ePub downloads, according to the available data) and Abstracts Views on Vision4Press platform.
Data correspond to usage on the plateform after 2015. The current usage metrics is available 48-96 hours after online publication and is updated daily on week days.
Initial download of the metrics may take a while.