Open Access
Fig. 5
Download original image
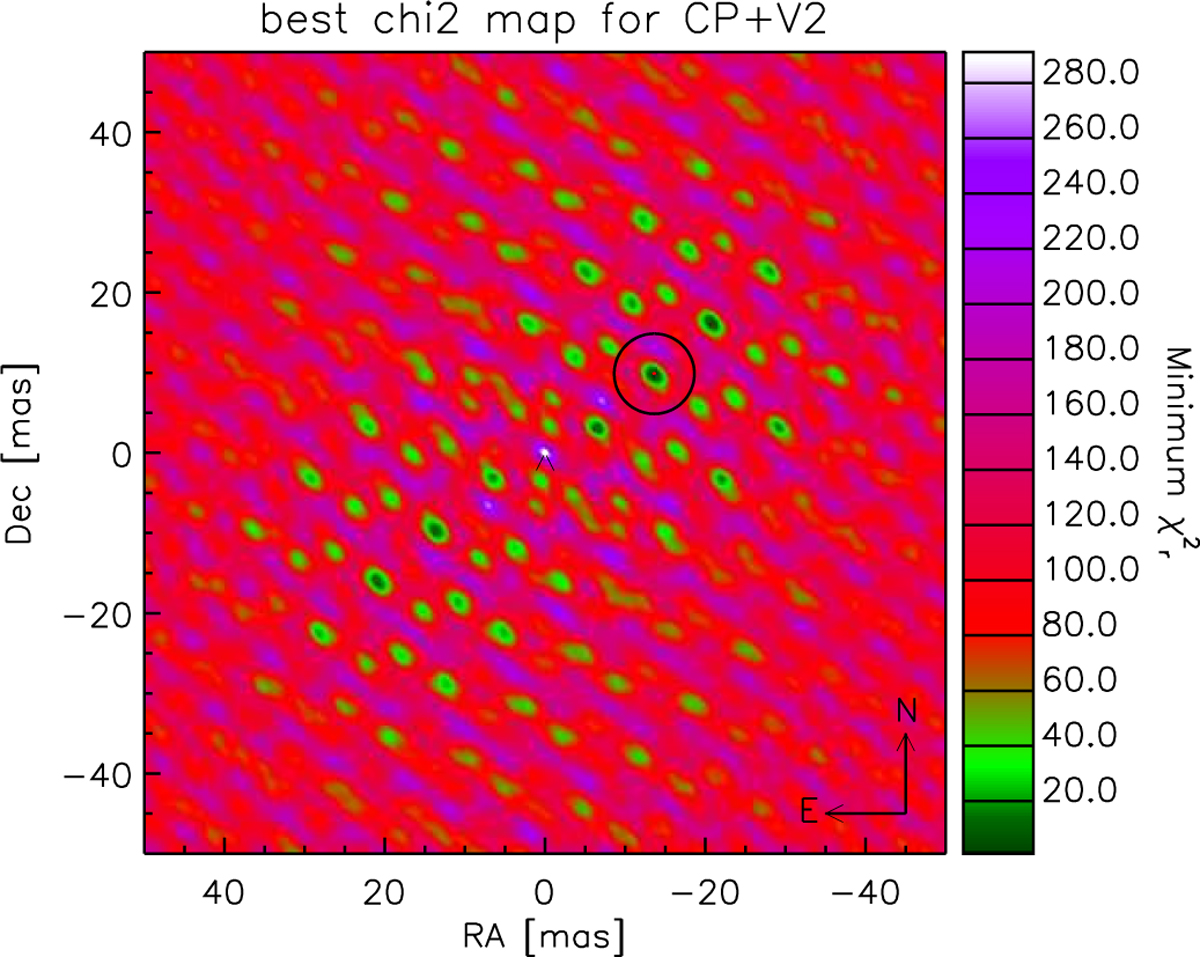
Normalised χ2 map of the combined V2+CP analysis for the VLTI/PIONIER observation. The white star at the centre marks the (fixed) position of the primary star in the binary model, while the black circle indicates the position of the minimum in the map, i.e. the most likely position for the companion.
Current usage metrics show cumulative count of Article Views (full-text article views including HTML views, PDF and ePub downloads, according to the available data) and Abstracts Views on Vision4Press platform.
Data correspond to usage on the plateform after 2015. The current usage metrics is available 48-96 hours after online publication and is updated daily on week days.
Initial download of the metrics may take a while.