Fig. 7
Download original image
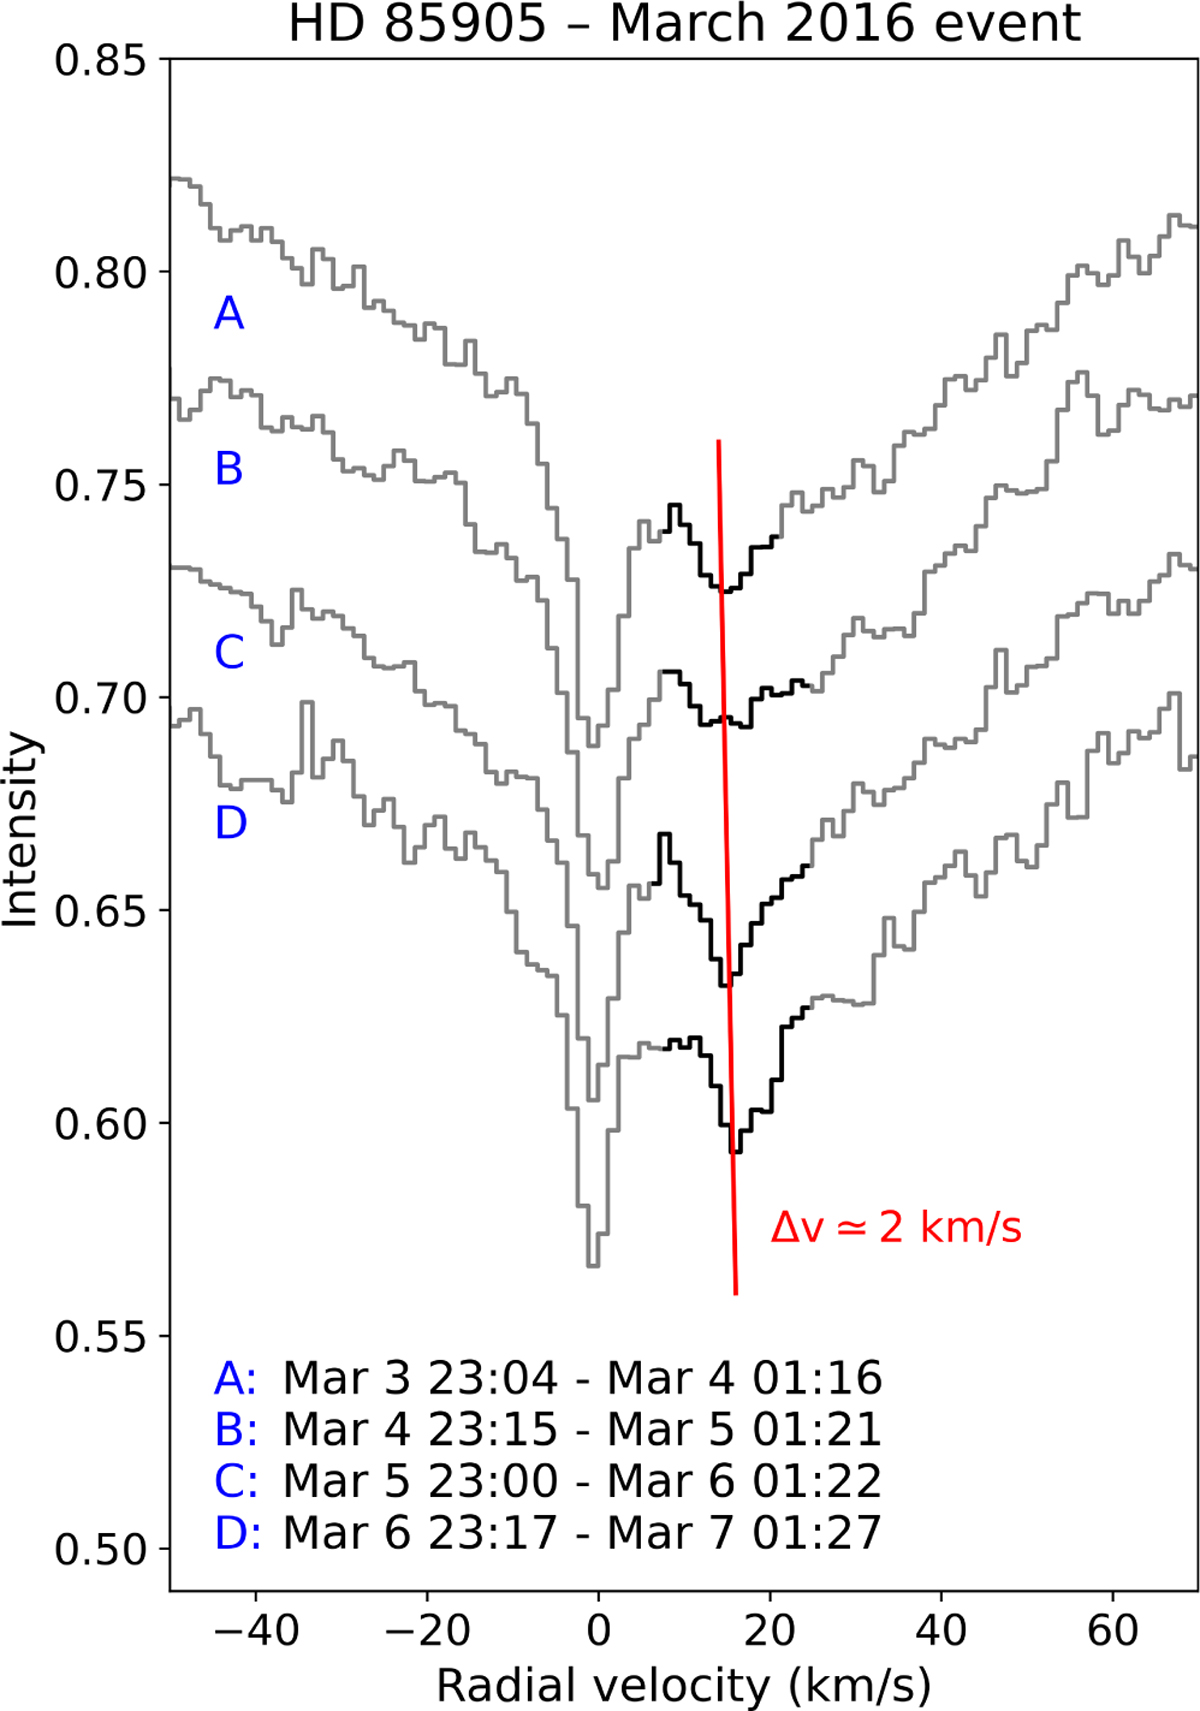
Example of variability in the circumstellar Ca II K component of HD 85905 on timescales of days. The plot shows the weighted mean of spectra obtained close in time at the beginning of four consecutive nights starting around UT 23:00 on 3–6 March 2016, with 4, 4, 3, and 3 spectra contributing to the respective means. Variability in the component at ∼ 23 km/s is clearly visible; its minima, joined by a red line, are redshifted by ∼ 2 km/s from spectrum A to D, hinting to a mild acceleration of the clump of gas producing that absorption.
Current usage metrics show cumulative count of Article Views (full-text article views including HTML views, PDF and ePub downloads, according to the available data) and Abstracts Views on Vision4Press platform.
Data correspond to usage on the plateform after 2015. The current usage metrics is available 48-96 hours after online publication and is updated daily on week days.
Initial download of the metrics may take a while.