Fig. 1
Download original image
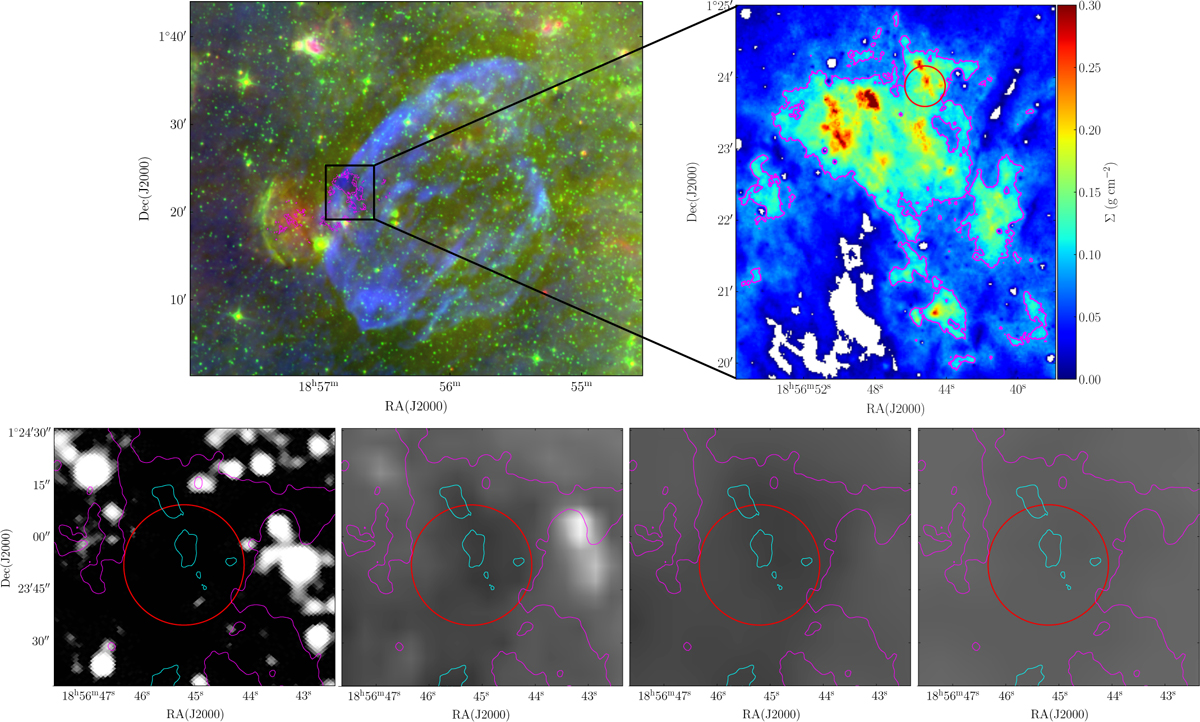
Top left : three colour image of G34.77. Red is 24 μm emission from the MIPSGAL survey (Carey et al. 2009), green is 8 μm emission from the GLIMPSE survey (Churchwell et al. 2009), and blue is 1 GHz continuum emission from the THOR survey (Beuther et al. 2016). Top right : mass surface density map (colour scale; Kainulainen & Tan 2013) with the red circle indicating the location of the Clump. Bottom panels : zoom-in views of the Clump at 2 μm (2MASS; Skrutskie et al. 2006), 8 μm (Carey et al. 2009), 24 μm (Churchwell et al. 2009), and 70 μm (Hi-GAL Molinari et al. 2010) emission. The cyan contours correspond to a mass surface density value of 0.3 g cm−2. In all panels, the magenta contour corresponds to a mass surface density of 0.1 g cm−2 and highlights the cloud outskirts. The red circle size corresponds to 44″, i.e. the largest beam size in the Yebes-40m observations.
Current usage metrics show cumulative count of Article Views (full-text article views including HTML views, PDF and ePub downloads, according to the available data) and Abstracts Views on Vision4Press platform.
Data correspond to usage on the plateform after 2015. The current usage metrics is available 48-96 hours after online publication and is updated daily on week days.
Initial download of the metrics may take a while.