| Issue |
A&A
Volume 707, March 2026
|
|
|---|---|---|
| Article Number | A95 | |
| Number of page(s) | 12 | |
| Section | Interstellar and circumstellar matter | |
| DOI | https://doi.org/10.1051/0004-6361/202557900 | |
| Published online | 04 March 2026 | |
Chemical complexity in star formation induced by stellar feedback: Cores shock-formed by the supernova remnant W44
1
Institut de Radioastronomie Millimétrique,
300 Rue de la Piscine,
38400
Saint-Martin-d’Hères,
France
2
Centro de Astrobiología (CSIC/INTA),
Ctra. de Torrejón a Ajalvir km 4,
Madrid,
Spain
3
INAF Osservatorio Astronomico di Arcetri,
Largo E. Fermi 5,
50125
Florence,
Italy
4
Max Planck Institute for Extraterrestrial Physics,
Giessenbachstrasse 1,
85748
Garching bei München,
Germany
5
Laboratory for the study of the Universe and eXtreme phenomena (LUX),
Observatoire de Paris, 5, place Jules Janssen,
92195
Meudon,
France
6
Rosseland Centre for Solar Physics, University of Oslo,
PO Box 1029
Blindern,
0315
Oslo,
Norway
7
Institute of Theoretical Astrophysics, University of Oslo,
PO Box 1029
Blindern,
0315
Oslo,
Norway
8
Department of Space, Earth and Environment, Chalmers University of Technology,
412 96
Gothenburg,
Sweden
9
Department of Astronomy, University of Virginia,
530 McCormick Road
Charlottesville
22904-4325,
USA
10
Instituto de Astrofísica de Andalucía,
CSIC, Glorieta de la Astronomía s/n,
18008
Granada,
Spain
11
European Southern Observatory (ESO),
Karl-Schwarzschild-Straße 2,
85748
Garching bei München,
Germany
12
Leiden Observatory, Leiden University,
PO Box 9513,
2300 RA
Leiden,
The Netherlands
13
Astrophysics Research Institute, Liverpool John Moores University,
146 Brownlow Hill,
Liverpool
L3 5RF,
UK
★ Corresponding author: This email address is being protected from spambots. You need JavaScript enabled to view it.
Received:
29
October
2025
Accepted:
8
December
2025
Abstract
Context. Low-velocity shocks from supernova remnants (SNRs) may set the physical and chemical conditions of star formation in molecular clouds. Recent evidence suggests that even the Sun might have formed through this process. However, the chemical conditions of shock-induced star-forming regions remain poorly constrained.
Aims. We study the chemical complexity of a shock-impacted clump, with the potential to yield star formation, named the Clump and located at the interface between the SNR W44 and the infrared dark cloud G034.77-00.55. We test whether the Clump has chemical properties consistent with those observed in star-forming regions unaffected by SNRs.
Methods. We used high-sensitivity, broad spectral surveys at 3 and 7 mm obtained with the 30m antenna at the Instituto de Radioastronomia Millímetrica and the 40 m antenna at the Yebes observatory, to identify D-bearing molecules and complex organic molecules (COMs) towards the Clump. For all species, we estimated molecular abundances and compared them with those observed across starforming regions at different evolutionary stages and masses, as well as comets.
Results. We detect multiple deuterated molecules (DCO+, DNC, DCN, CH2DOH) and COMs (CH3OH, CH3CHO, CH3CCH, CH3CN, CH3SH) with excitation temperatures of 5-13 K. To the best of our knowledge, this is the first detection of COMs towards a site of SNR-cloud interaction. The derived D/H ratios (~0.01-0.04) and COM abundances are consistent with those reported towards typical low-mass starless cores and comparable to cometary values. The overall level of chemical complexity is relatively low, in line with an early evolutionary stage.
Conclusions. We suggest that the Clump is an early stage shock-induced low-mass star-forming region, not yet protostellar. We speculate that SNR-driven shocks may set the physical and chemical conditions to form stars. The resulting chemical budget may be preserved along the formation process of a planetary system, being finally incorporated into planetesimals and cometesimals.
Key words: ISM: abundances / ISM: clouds / ISM: molecules / ISM: supernova remnants / ISM: individual objects: G034.77-00.55 / ISM: individual objects: W44
© The Authors 2026
 Open Access article, published by EDP Sciences, under the terms of the Creative Commons Attribution License (https://creativecommons.org/licenses/by/4.0), which permits unrestricted use, distribution, and reproduction in any medium, provided the original work is properly cited.
This article is published in open access under the Subscribe to Open model. This email address is being protected from spambots. You need JavaScript enabled to view it. to support open access publication.
1 Introduction
Supernova remnants (SNRs) are among the most energetic (Bally 2011) and long-lasting (Leitherer et al. 1999; Agertz et al. 2013) sources of feedback that affect the interstellar medium (ISM). Relatively slow shocks (a few tens of km s−1) driven by late-stage expanding SNR shells can sweep up the surrounding material, increasing its density (Inoue et al. 2018; Cosentino et al. 2019, 2022; Sano et al. 2020, 2023) and enhancing its star formation potential (Barnes et al. 2023; Khullar et al. 2024; Beattie et al. 2025). The resulting high post-shock densities enable rapid
gas cooling and enhanced chemical reactions (Fragile et al. 2003), which can in turn trigger gravitational collapse even of initially stable clouds (Li et al. 2014). Recent simulations further suggest that shocks can funnel gas into filaments, setting the conditions under which gravity can drive star formation (Federrath & Klessen 2012; Appel et al. 2023).
There is also growing evidence that even our own Sun may have formed within a massive star-forming region shaped by stellar feedback (Adams 2010; Gounelle & Meynet 2012; Pfalzner et al. 2015), where at least one nearby supernova played a pivotal role (Boss & Keiser 2013; Young 2014; Parker et al. 2023). According to this scenario, a supernova shock impacting the proto-solar core may have triggered its collapse, while simultaneously enriching the material with radioactive and chemically processed ejecta (e.g. Boss & Keiser 2010). The presence of short-lived radionuclides, such as 26Al and 60Fe, in primitive meteorites supports this scenario (Ouellette et al. 2007, 2009; Desch et al. 2022). It has also been suggested that the Sun, as other Sun-like stars, may have emerged within complex hub-filament systems, where star formation is promoted by filament mergers induced by both early feedback in the form of HII regions and later-stage shocks from SNRs (Arzoumanian et al. 2023).
Studying chemical complexity in dense cores within molecular clouds that are affected by interaction with SNRs offers a unique opportunity to probe this scenario. However, direct observations of these environments remain scarce. Toward the SNRs W41 (Hogge et al. 2019) and IC443 (Reach et al. 2024), indirect evidence of cores has been reported, but these may have preexisted the shock and be negatively affected by it i.e., the shock is dispersing them, making it unlikely that they will collapse to form stars (Zhou et al. 2021 ; Cosentino et al. 2022; Reach et al. 2024). More recently, Cosentino et al. (2025) identified signatures of early-stage star formation towards the infrared dark cloud (IRDC) G034.77-00.55 (thereafter G034.77), shock-interacting with the nearby SNR W44. W44 is a 20k years old, core-collapse SNR located 2.9 kpc away (Lee et al. 2020) and driving a relatively slow shock (~ 15-20 km s−1; Sashida et al. 2013; Cosentino et al. 2019) into the western edge of G034.77. The authors used high-angular resolution N2H+(1-0) images obtained with the Atacama Large Millimetre/sub-millimetre Array (ALMA) to reveal the presence of multiple cores at the shock interface. Several factors support the scenario that the core formation may have been triggered by the shock passage. The density of the post-shocked gas (≥106 cm−3), traced by C18O in Cosentino et al. (2019) and N2H+ in Cosentino et al. (2025), is reported to be consistent with that typically found in star-forming regions (Cosentino et al. 2019). This dense post-shocked gas is significantly blue-shifted (39-42 km s−1 Cosentino et al. 2019) with respect to the main cloud’s velocity (43-45 km s−1 Rathborne et al. 2006; Hernandez & Tan 2015). The cores identified by Cosentino et al. (2025) show densities and kinematics consistent with that of the post-shocked gas. Moreover, the cores are distributed along two filaments whose orientation is consistent with that of the shock front. In Cosentino et al. (2023), the D/H ratio towards the post-shocked material was reported to be enhanced with respect to the inner cloud and comparable to that of other early stage star-forming regions. Finally, the presence of N2D+ emission in the post-shocked gas suggests that this is likely to be dense and cold material, i.e. it has high potential to harbour star formation. Hence, the kinematic and morphological link between the post-shocked gas and the cores, as well as their similar physical conditions, suggests that the core formation might have been enabled by the shock passage. The shock is therefore responsible for setting physical conditions within the cores that are similar to those observed in star-forming regions.
The majority of the cores appear gravitationally unstable considering thermal and turbulent support. In the 1.2 mm maps obtained by Rathborne et al. (2006) with the IRAM-30 m Max-Plank Millimeter Bolometric camera, MAMBO II (11" or 0.15 pc) and in the 3 mm ALMA images (3" or 0.04 pc) reported by Barnes et al. (2021) and Cosentino et al. (2019), no continuum emission is found towards the cores. Finally, the cores are not associated with point-like sources at 8, 24 and/or 70 μm (Paron et al. 2009; Barnes et al. 2016), which suggests that no central protostars are present towards the cores. In light of all this, Cosentino et al. (2025) suggest that shocks driven by the SNR W44 may have impacted the cloud, enhanced the gas density, and triggered the formation of the identified cores. Hence, the cores may be regions of shock-induced star formation.
Across the region of G034.77 where the core population is located, the pointing previously identified as Clump (Cosentino et al. 2023) has the highest star formation potential (Cosentino et al. 2025). It shows a high mass surface density of Σ > 0.1 g cm−2 and a D/H ratio of ~0.1, measured as the ratio between the N2D+ and N2H+ column densities obtained with singlepointing observations. This is consistent with values typically measured in both low-mass (Crapsi et al. 2005; Friesen et al. 2013; Cheng et al. 2021) and high-mass (Fontani et al. 2006, 2011; Kong et al. 2016) starless and pre-stellar cores. Therefore, the Clump has the potential to be a unique laboratory for investigating the chemical complexity of pre-stellar cores whose formation might have been induced by stellar feedback.
In this work, we investigate the Clump’s chemical inventory, also in relation with that of Galactic star-forming regions at different evolutionary stages, as well as meteorites and comets, which are likely carriers of the pristine proto-solar environment. In particular, we measure deuterium fractionation in multiple species and assess the presence of complex organic molecules (COMs). D/H ratios derived from different tracers are valuable complementary indicators of a core’s evolutionary stage (Fontani et al. 2006; Caselli et al. 2008; Ceccarelli et al. 2014; Bianchi et al. 2017; Sabatini et al. 2019; Bovino et al. 2021; Colzi et al. 2022). For instance, deuterium fractionation measured from N2D+ and N2H+ increases during the starless and pre-stellar phase and decreases during the proto-stellar phase (Crapsi et al. 2005; Emprechtinger et al. 2009). On the other hand, deuterium fractionation measured from HNC and HCO+ has a less steep decline (Fontani et al. 2014; Gerner et al. 2015). For instance, Fontani et al. (2015) found that the DNC/HNC column density ratio is less sensitive than the N2D+/N2H+ ratio across different stages of high-mass star formation.
Detections of COMs have been reported in a wide variety of environments (see Ceccarelli et al. 2022, for a review). Traditionally associated with hot cores (e.g. Brown et al. 1975; Blake et al. 1987) and corinos (Cazaux et al. 2003; Bianchi et al. 2019; Martín-Doménech et al. 2021), COMs have also been observed in starless and pre-stellar cores (e.g. Jiménez-Serra et al. 2016; Scibelli et al. 2021; Megías et al. 2023; Scibelli et al. 2024), dark clouds (e.g. Agúndez et al. 2015; Marcelino et al. 2020; Cernicharo et al. 2021), translucent clouds (Thiel et al. 2017), and protoplanetary discs (e.g. Walsh et al. 2014). Their abundance evolution during the star-formation process has been investigated in recent studies (Coletta et al. 2020; Bhat et al. 2023), which indicates an increasing trend from the starless and pre-stellar phase to the protostellar phase.
The paper is organised as follows. In Sect. 2, we describe the data and the observation strategy. In Sect. 3, we identify the molecular species of interest and measure their abundances. In Sect. 4, we present and discuss our results. Finally, in Sect. 5, we present our conclusions.
2 Observations and data
2.1 IRAM-30 m observations
In this work, we use 3 mm and 7 mm single pointing observations obtained in March 2020 with the 30 m antenna at IRAM (Pico Veleta, Spain) and in April 2024 with the 40 m antenna at the Yebes Observatory (Castilla-La Mancha, Spain), respectively. Observations were acquired towards the position previously identified as Clump by Cosentino et al. (2023) and centred at RA(J2000)=18h56m45.2s, Dec(J2000)=1d23m52s) with off position RA(J2000)=18h57m01s, Dec(J2000)=1d22m25s. In Fig. 1, the location of the IRDC G034.77 with respect to the SNR W44 is shown (top left panel). The location of the Clump within the cloud is also indicated (top right panel), as well as a zoom-in view at multiple wavelengths from archival data (bottom panels). From Fig. 1, no IR signatures of deeply embedded protostars are found, which confirms the results already presented by Barnes et al. (2021) and Cosentino et al. (2025).
Both sets of observations were performed in dual polarisation and position-switching mode. For the IRAM-30m observations, we used the EMIR90 receiver, tuned at frequencies of 74.0 and 86.0 GHz, to cover a continuous frequency range of 71.9-102.3 GHz. We also used the Fast Fourier Transform Spectrometer (FTS) with a frequency resolution of 200 kHz, corresponding to a velocity resolution between 0.7 and 0.8 kms−1. Intensities were measured in units of antenna temperature, T*A, and converted into main-beam brightness temperature, Tmb, using beam and forward efficiencies of 0.81 and 0.95, respectively. The angular resolution of the 30 m antenna is between 34″ and 24″ in the 3 mm band. These correspond to a linear spatial resolution of 0.4-0.5 parsec at the distance of G34.77 i.e., 2.9 kpc (Lee et al. 2020).
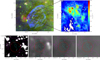 |
Fig. 1 Top left : three colour image of G34.77. Red is 24 μm emission from the MIPSGAL survey (Carey et al. 2009), green is 8 μm emission from the GLIMPSE survey (Churchwell et al. 2009), and blue is 1 GHz continuum emission from the THOR survey (Beuther et al. 2016). Top right : mass surface density map (colour scale; Kainulainen & Tan 2013) with the red circle indicating the location of the Clump. Bottom panels : zoom-in views of the Clump at 2 μm (2MASS; Skrutskie et al. 2006), 8 μm (Carey et al. 2009), 24 μm (Churchwell et al. 2009), and 70 μm (Hi-GAL Molinari et al. 2010) emission. The cyan contours correspond to a mass surface density value of 0.3 g cm−2. In all panels, the magenta contour corresponds to a mass surface density of 0.1 g cm−2 and highlights the cloud outskirts. The red circle size corresponds to 44″, i.e. the largest beam size in the Yebes-40m observations. |
2.2 YEBES-30 m observations
The Yebes-40 m observations at 7 mm were performed in Q-band, covering a continuous frequency range 31.3-49.5 GHz and using the Fast Fourier Transform (FFT) spectrometer with spectral resolution of 38 kHz (~0.25 km s−1). To increase the signal-to-noise ratio, we smoothed the spectra in velocity, using the function SMOOTH in GILDAS and obtaining final velocity resolution in the range 0.5-0.7 km s−1. Intensities were converted from T*A to Tmb using beam and forward efficiencies of 0.61 and 0.95, respectively. Observations performed with the 40m antenna have an angular resolution between 36″ and 44″ i.e., 0.5-0.6 pc at the source distance. This information is summarised in Table 1. The final spectra were produced using the CLASS software within the GILDAS package1 and have rms per channel between 7 and 5 mK for the IRAM-30m observations and 3-5 mK for the Yebes-40m observations.
2.3 MIREX map
For our analysis, we also employ the mass surface density, Σ, map obtained towards G034.77 by Kainulainen & Tan (2013) and shown in the top right panel of Fig. 1. To obtain this map, the authors extended the MIREX method previously developed by Butler & Tan (2012), combining multi-wavelengths mid- and iear-infrared Spitzer images of the cloud. The obtained mass surface density map has an angular resolution of 2″, consistent with the resolution of the Spitzer-IRAC maps and the uncertainty is estimated to be ~30% (Kainulainen & Tan 2013). Since the MIREX method is not suitable to estimate mass surface densities towards sources that are bright at mid-IR wavelengths, pixels towards which the method is not applicable appear as blank (white) in the map. For a more detailed description of the MIREX method, we refer the reader to Butler & Tan (2009, 2012) and Kainulainen & Tan (2013).
Telescope, frequency ranges, rms noise (Tmb), velocity resolution, and beam aperture of the observations presented in this work.
3 Method
3.1 Line identification
The first step in our analysis was to identify species of interest in the large bandwidth spectra. For this, we used the tool Spectral Line Identification and Modelling (SLIM) within the MADCUBA software2 (Martín et al. 2019). MADCUBA is a stand-alone, interactive tool specifically tailored for the analysis of spectra and spectral cubes. It allows us to perform line identification and line modelling in local-thermodynamic-equilibrium (LTE) conditions. Using the spectroscopic parameters available in the Cologne Database for Molecular Spectroscopy3 (CDMS; Endres et al. 2016) and the Jet Propulsion Laboratory4 (JPL; Pickett et al. 1998), we used SLIM to identify D-bearing species (and their H-bearing counterparts) and COMs within our spectra. We consider all those transitions for which the integrated intensity is at least a factor of three larger than the integrated noise as detection5. In Table A.1, we report the transitions, frequencies, and spectral parameters as well as the integrated signal-to-noise ratio for each detected species. Among the identified deuterated species, we report DCO+, DNC, and DCN. Within the COMs group, we identify CH3OH, CH3CHO, CH3CCH, CH3SH, and CH3CN. Moreover, we report the detection of two transitions of singly deuterated methanol, CH2DOH. We note that bright species such as HCO+, HNC, HCN, and CH3OH, counterparts to the identified D-bearing species, are detected but they are very bright and strongly suffer from optical depth effects. Hence, for further analysis, we consider their 13C-bearing counterparts, which are most optically thin but still significantly bright (S∕N≥5O). This is confirmed by MADCUBA, which indicated for all identified species an optical depth τ ≤ 0.03. Within MADCUBA, we also use the function AUTOFIT to obtain the best fit to the species’ spectral profiles. For each species, the function assumes all transitions to have the same central velocity and linewidth and return the LTE model that best reproduces the line profile of all transitions simultaneously. The obtained bestfit values of central velocity, linewidth, and integrated flux are listed in Table A.1.
3.2 Molecular abundances
For each detected molecule, we estimated the molecular abundance with respect to H2 as
 (1)
(1)
where N(X) and N(H2) are the species and the molecular hydrogen total column densities, respectively. To estimate N(H2), we considered the mean Σ value within the largest beam in our observations, and converted this to total column density using a molecular hydrogen mass of m(H2)=3.67×10⁻²⁴ g, as follows:
 (2)
(2)
The employed molecular hydrogen mass also include a 10% contribution of helium per hydrogen atom. The derived molecular hydrogen column density is N(H2)=(3.8±1.1)×1022 cm−2, where the uncertainty is due to the 30% uncertainty in the Σ value (Kainulainen & Tan 2013).
To estimate the total column density, N(X), of all the detected molecules, we first analysed species for which more than three transitions (with significantly different excitation energies) were detected. This is the case for 13CH3OH, CH3CHO, CH3CCH, and CH3CN. For these species, we used MADCUBA to build rotational diagrams from the line integrated intensities and estimated the molecule excitation temperature, Tex, and total column density, N(X). The obtained rotational diagrams are shown in Fig. 2. We obtained excitation temperatures in the range Tex ~ 5-13 K and total column densities Ntot ~ 0.8-20×1012 cm−2. We note that the Tex obtained for 13CH3OH and other COMs is consistent, within the uncertainty, with Tex = 9 K estimated for CH3OH in Cosentino et al. (2018); the only exception is CH3CHO, for which we report a lower value of Tex ~ 5 K, in both the A and E forms.
For the remaining species listed in Table A.1, either we only detected one rotational transition (H13CO+, DCO+, HN13C, DNC) or multiple transitions with very little energy difference, i.e. not sufficient to build rotational diagrams (H13CN, DCN, and CH2DOH). For these species, we fixed the excitation temperature at both Tex = 5 K and 13 K, i.e., the minimum and maximum Tex found with the multi-transition approach, and used the AUTOFIT function in SLIM to estimate the total column density. Hence, we considered the best values as the mean between the two obtained column densities and associated an uncertainty as half the difference between the two values. The obtained values were then converted into abundances using Eq. (1). Finally, for all the detected D-bearing species, we calculated the deuterium fractionation (D/H ratio) as the ratio between the column densities of the deuterated species and its non-deuterated counterpart. For the latter, when derived from the 13C-bearing isotopologue, we assumed an isotopic ratio 12C∕13C=49.8, as specifically calculated by Zeng et al. (2017) for G034.77. We also note that, as described by Parise et al. (2004) and Manigand et al. (2019), the D/H ratio from CH2DOH and CH3OH corresponds to three times the column density ratio between these species. The final values of the column density, excitation temperature, molecular abundance, and deuterium fractionation obtained with the above method are reported in Table 2, where we also list the COMs abundance relative to CH3OH. The CH3OH column density was obtained from N(13CH3OH), assuming 12C/13C=49.8 (Zeng et al. 2017). We estimate N(CH3OH)=(6±4)×1014 cm−2, a value consistent with those previously reported towards the massive cores G1, G2, and G3 within G034.77 (Cosentino et al. 2018).
We note that a filling factor = 1 was assumed in the analysis described above. This assumption was adopted because we do not know the actual source size, which is required to correct for the beam dilution effect. Moreover, the Clump most likely hosts multiple condensations (Cosentino et al. 2025) and one should also account for the number of sources within the beam. Hence, since both pieces of information are uncertain, we did not correct for them and the COM abundance values reported here may be regarded as lower limits.
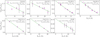 |
Fig. 2 Rotational diagrams obtained using MADCUBA for 13CH3OH, CH3CCH, CH3CHO, CH3CN, and CH3SH. Magenta empty squares indicate the data points, while the green lines show the best fitting found by MADCUBA. In all panels, the corresponding species is indicated together with the inferred excitation temperature, Tex, and total column density, Ntot. |
Molecular species, total column density, excitation temperature, molecular abundance with respect to H2, deuterium fractionation values, and COM abundances with respect to CH3OH obtained for all the species of interest.
4 Results and discussion
4.1 D-bearing species
Using the method described in Sect. 3, we derive D/H ratios ranging from 0.01 to 0.09, all enhanced by several orders of magnitude with respect to the typical cosmic D/H ratio ~10−5 (Oliveira et al. 2003). The deuterium fractionation values derived from DCO+ and DNC are consistent within the uncertainties, while the D/H ratio from DCN is nearly a factor of three lower. This agrees with previous studies suggesting that D/H ratios inferred from DCN may be anti-correlated with other deuterated species i.e., it tends to be higher in more evolved sources, whereas the D/H ratio from other molecules is expected to peak at earlier phases (Fontani et al. 2015). The D/H values reported here are approximately a factor of two to three lower than that derived from N2D+ (~0.1 Cosentino et al. 2025). This likely reflects the fact that, contrary to N2D+, other species may involve more complex formation pathways or be more sensitive to grain-surface chemistry (Ceccarelli et al. 2014).
In Fig. 3, we compare our measurements with literature values for low-mass starless and pre-stellar cores (Hirota et al. 2001 ; Redaelli et al. 2019; van Gelder et al. 2021; Ambrose et al. 2021; Petrashkevich et al. 2024) and low-mass protostars (Hirota et al. 2001; Jørgensen et al. 2004; Emprechtinger et al. 2009; Imai et al. 2018; van Gelder et al. 2021), high-mass IR-dark clumps (Gerner et al. 2015; Yang et al. 2024), high-mass protostellar objects (Gerner et al. 2015; van Gelder et al. 2022; Bouscasse et al. 2022), and comets (Meier et al. 1998; Biver et al. 2019; Despois et al. 2005; Crovisier et al. 2004; Drozdovskaya et al. 2021). We find that the D/H ratios derived from DCO+, DNC, and CH2DOH broadly agree with those reported for low-mass starless and pre-stellar cores and protostars. However, the lack of compact continuum sources at 1 and 3 mm (Rathborne et al. 2006; Barnes et al. 2021), as well as the lack of point-like IR emission (Paron et al. 2009; Barnes et al. 2021), seems to indicate that the Clump is at an early evolutionary stage, that is, either the pre-stellar or very early protostellar stage. On the other hand, the D/H ratio derived from DCN in the literature shows little variation across different environments. DCN lines have relatively lower S/N compared with other D-bearing tracers. Hence, the D/H measurements from DCN are usually less constrained. It is therefore more challenging to establish significant variations, even considering the large samples extracted from the literature. In Fig. 3 we also compare our results with typical D/H ratios reported for well-known comets (Meier et al. 1998; Biver et al. 2019; Despois et al. 2005; Crovisier et al. 2004; Drozdovskaya et al. 2021), meteorites (Busemann et al. 2006; Remusat et al. 2006; Robert 2003; Alexander et al. 2007, 2010, 2012, 2017), and the protosolar nebula (Lellouch et al. 2001). The latter value is derived from measurements of Jupiter. Our values are consistent within the uncertainties with those reported for comets, although these are often upper limits. On the other hand, our values are systematically higher by at least one order of magnitude than the protosolar nebula and meteorite values. We speculate that this discrepancy may be due to the fact that multiple chemical resets may occur between the shock-induced star formation and the final planetary system stage (Romero-Mirza et al. 2022; Öberg et al. 2023). In light of all this, the Clump is most likely consistent with a pre-stellar core-like deuterium chemistry.
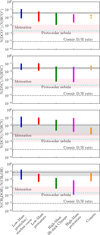 |
Fig. 3 D/H ratios measured from DCO+, DNC, DCN, and CH2DOH towards the Clump (dashed black lines and grey shadows) compared with literature values across low-mass starless and pre-stellar cores and low-mass protostars, high-mass IR-dark clumps, high-mass protostellar objects, and comets. For reference, we report the cosmic D/H ratio (dotted-dashed black line; Oliveira et al. 2003) and the D/H measured in meteorites (red shadow) and proto-solar nebula (dotted cyan line). |
4.2 Complex organic molecules
Within our high-sensitivity, broad bandwidth spectra, we detected several complex molecules, i.e., 13CH3OH, CH3CCH, CH3CHO, CH3CN, and CH3SH. This is a relatively low level of complexity compared with other typical low-mass starless and pre-stellar cores (Jiménez-Serra et al. 2016; Bianchi et al. 2017; Gorai et al. 2024). This reduced complexity may be due to G034.77 and the Clump being located further away (several kiloparsecs) than typical low-mass sources (a few hundreds of parsecs) and/or to the poorer sensitivity of our observations. Alternatively, the lower degree of chemical complexity may be indicative of the Clump being at an earlier evolutionary stage, similarly to what was reported by Megías et al. (2023) for other low-mass starless cores. Alternatively, beam dilution effects may prevent us from detecting more complex, fainter species. Future high-angular resolution images will allow more precise estimates and enable us to distinguish between these possibilities.
Although detections of COMs in the ISM are common, information from the literature is more sparse than what was presented in Sect. 4.1 for D-bearing molecules, and a similar comparison cannot be carried out. Therefore, for each broad evolutionary stage and mass regime, we considered sources that are often regarded as an archetype of that specific environment and compared COMs abundances with those estimated towards the Clump. We considered L1544 (Vastel et al. 2014; Bizzocchi et al. 2014; Jiménez-Serra et al. 2016; Vastel et al. 2019; Jiménez-Serra et al. 2021) and TMC-1 (Gratier et al. 2016; Cabezas et al. 2021; Agúndez et al. 2025) as representative of low-mass pre-stellar cores (LMPSCs), I00117-mM2 and G11.11 as typical high-mass pre-stellar core candidates and/or IRDC environment (Vasyunina et al. 2014; Fontani et al. 2015; Mininni et al. 2021), and IRAS 16293B and G31.41+0.31 represent typical corinos and hot cores, respectively (Kolesniková et al. 2014; Brinkmann et al. 2020; Feng et al. 2015; Mininni et al. 2023; López-Gallifa et al. 2024; Gorai et al. 2024). Finally, we considered the comets 67P∕Churyumov-Gerasimenko and Hale-Bopp (Bockelée-Morvan et al. 2000; Le Roy et al. 2015; Altwegg et al. 2016). The comparison is presented in Fig. 4 where COMs abundances are reported with respect to methanol.
From Fig. 4, all COM abundances normalised to methanol are consistent with the typical cometary environment, similarly to the D-bearing species analysed in this work. The CH3CCH abundance normalised to methanol is significantly lower than that observed in typical dark sources but higher than or at most similar to that expected in warmer sources. CH3CCH is known to be a reliable tracer of gas excitation conditions (e.g. Taniguchi et al. 2018; Calcutt et al. 2019). Although its formation pathways are highly uncertain, this species has been detected in a plethora of environments, including external galaxies (Mauersberger et al. 1991; Qiu et al. 2020). While CH3CCH is often regarded as a tracer of intermediate temperatures in highmass star-forming cores (Fontani et al. 2002), it can also be found in hot cores and hot corinos, both associated with the cold envelope (T<60 K) and a hotter, inner component (T>100 K; Herbst & van Dishoeck 2009). Towards the Clump, we report very low Tex ~ 7 K. At these low values of excitation temperature, the kinetic temperature is expected to be similar (Walmsley & Ungerechts 1983; Zeng et al. 2018), which indicates that the CH3CCH emission is associated with cold gas, i.e., not compatible with hot core and corinos conditions as seen in Fig. 4. This is also supported by the lack of IR point-like source within the beam. However, from Fig. 4, the CH3CCH abundance with respect to CH3OH is also slightly lower than what was reported towards L1544 and TMC-1. A possible explanation is that the emission from these species is unresolved in our single pointing data and may have a different spatial extent. This is instead not the case for L1544 and TMC-1, which are closer and have been studied in much more detail, leading to more accurate measurements. Moreover, while the Clump is not spatially coincident with the shock front detected in Cosentino et al. (2018, 2019), it is possible that some contamination is present within the beam. Higher angular resolution images will shed light on these scenarios.
Contrary to CH3CCH, the species CH3CHO shows an abundance with respect to methanol that is consistent with that of typical LMPSCs and slightly higher than that observed in warmer regions. Indeed, the low excitation temperature measured for this species, Tex ~ 5 K, suggests that the emission may be sub-thermally excited. Moreover, the ratio with respect to CH3OH reported here, ~0.03, is more than one order of magnitude larger than that typically measured in shocks from molecular outflows (10−4−10−3; Holdship et al. 2019; Codella et al. 2020; López-Sepulcre et al. 2024).
As seen in Fig. 4, CH3CN shows an abundance with respect to methanol that is significantly lower than that measured in LMPSCs (e.g. Bhat et al. 2023) and consistent with that typically measured in hot corinos but not towards hot cores. Similarly to CH3CCH, this may be due to the fact that the true emission spatial extent remains unresolved in our observations, which leads to beam-dilution effects at the larger source distance. CH3CN has been widely used to investigate the physical conditions of warm environments, and Codella et al. (2009) showed that it can also be efficiently produced in shocked regions. While the excitation temperature measured here is lower than that reported by Codella et al. (2009), the abundance with respect to methanol is consistent with that reported towards the shocked knots of the L1157 outflows (see also Arce et al. 2008).
From Fig. 4, the CH3SH abundance with respect to methanol is consistent with that estimated toward low-mass starless and pre-stellar cores and hot cores. Towards LMPSCs, it has been suggested that CH3SH forms onto the icy mantle of dust grains and it is then released into the gas phase through non-thermal processes, such as cosmic-ray-induced desorption (e.g. Zhou et al. 2022). However, the formation pathway of these species is still unclear and follow-up high-resolution observations are needed to spatially resolve the emission and further constrain the emitting regions for CH3SH and CH3CN.
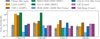 |
Fig. 4 Comparison between COM abundances with respect to CH3OH measured towards the Clump and literature values towards L1544 (LMPSC; Vastel et al. 2014; Bizzocchi et al. 2014; Jiménez-Serra et al. 2016; Vastel et al. 2019), TMC-1 (dark clouds; Gratier et al. 2016; Cabezas et al. 2021; Agúndez et al. 2025), I00117-MM2 and G11.11 (high-mass cores and/or IRDCs; Vasyunina et al. 2014; Fontani et al. 2015; Mininni et al. 2021), IRAS 16293B (hot corino) and G32.41+0.31 (hot core; Mininni et al. 2023; López-Gallifa et al. 2024), and the comets 67P∕Churyumov-Gerasimenko and Hale-Bopp (Bockelée-Morvan et al. 2000; Le Roy et al. 2015; Altwegg et al. 2016). The colours are representative of the environment: orange and dark orange for low-mass cores and dark clouds, green and dark green for massive cores/IRDCs, blue and dark blue for more evolved hot cores and corinos, and pink and purple for comets. |
5 Summary and conclusions
We present high-sensitivity single pointing observations obtained at 3 mm (IRAM 30 m) and 7 mm (Yebes-40 m) towards the shock-induced potentially pre-stellar cluster known as the Clump (Cosentino et al. 2023). Within the large bandwidth spectra, we identified multiple D-bearing species such as DCO+ , DNC, DCN, and CH2DOH, as well as multiple COMs, i.e., CH3OH, CH3CHO, CH3CCH, CH3CN, and CH3SH. The D/H ratios measured from the detected D-bearing species and their H-bearing counterparts are several orders of magnitude larger than the typical cosmic D/H ratio and broadly consistent with those observed in low-mass starless and pre-stellar cores. Within the high-sensitivity spectra, we also detected multiple COMs. The Clump shows a level of chemical complexity similar to that reported towards some young low-mass prestellar cores (younger than L1544) such as L1517B (Megías et al. 2023). This may be indicative of the source evolutionary stage, as already reported towards other low-mass star starless cores. Alternatively, this may be a consequence of beam dilution effects. Among the detected species, CH3CHO and CH3SH show abundance with respect to methanol that are consistent with that observed in low-mass starless and pre-stellar cores. On the other hand, the CH3CCH and CH3CN abundance normalised to methanol is slightly lower than values reported in low-mass environments, which suggests potential contamination from shocked gas. The chemical complexity and deuterium content of the region are consistent with the shock timescales estimated in Cosentino et al. (2019). Indeed, the enhanced densities reported for the post-shocked gas shorten the CO depletion timescale, boosting the production of deuterated species (Lis et al. 2002, 2016). For the post-shock density estimated by Cosentino et al. (2019), the CO depletion timescale is expected to be ≤104 yr (Caselli et al. 1999), which is consistent with both the shock dynamical age (few 104 yr; Cosentino et al. 2019) and the SNR age (20 kyr). Finally, we compared the abundances of all detected D-bearing species and COMs with those observed in comets and found a broad agreement. This similarity suggests that COM and deuterium budgets could be inherited from the compressed, cold, and dense post-shocked material, where the shock passage has enabled a fast chemistry. In light of all this, we suggest that the Clump is a shock-induced dense core at a very early stage of evolution with the potential to undergo gravitational collapse and form the next generation of protostars in the cloud. We also speculate that stellar-feedback slow shocks may contribute to set the initial chemical conditions of star formation, which is later on inherited by comets. Follow-up high-angular resolution images are needed to remove potential beam dilution effects and separate the emission arising from cores and the shocked gas. Nevertheless, to the best of our knowledge, this represents the first detection of COMs toward a SNR-molecular cloud interaction site, and it is a potentially unique signature of chemically enriched, post-shock, dense core formation. Finally, shocks from late-stage SNRs are intrinsically gentler and more spatially extended than those observed in molecular outflows. Therefore, if some of the detected COMs were released into the gas phase by the SNR-shock passage, this could lead the way to new investigations into the survival of COMs in shocked environments.
Acknowledgements
This work is based on observations carried out under project number 027-21 with the IRAM 30 m telescope. IRAM is supported by INSU/CNRS (France), MPG (Germany) and IGN (Spain). This work is also based on observations carried out with the Yebes-40m telescope (project 24A019).The 40m radio telescope at Yebes Observatory is operated by the Spanish Geographic Institute (IGN; Ministerio de Transportes, Movilidad y Agenda Urbana). J.C.T. acknowledges support from ERC project 788829-MSTAR. I.J-.S acknowledges funding from grant PID2022-136814NB-I00 funded by the Spanish Ministry of Science, Innovation and Universities/State Agency of Research MICIU/AEI/10.13039/501100011033 and by “ERDF/EU”. R.F. acknowledges support from the grants Juan de la Cierva FJC2021-046802-I, PID2020-114461GB-I00 and CEX2021-001131-S funded by MCIN/AEI/10.13039/501100011033 and by “European Union NextGenera-tionEU/PRTR”. S.V. acknowledges partial funding from the European Research Council (ERC) Advanced Grant MOPPEX 833460.
References
- Adams, F. C. 2010, ARA&A, 48, 47 [Google Scholar]
- Agertz, O., Kravtsov, A. V., Leitner, S. N., & Gnedin, N. Y. 2013, ApJ, 770, 25 [NASA ADS] [CrossRef] [Google Scholar]
- Agúndez, M., Cernicharo, J., & Guélin, M. 2015, A&A, 577, L5 [NASA ADS] [CrossRef] [EDP Sciences] [Google Scholar]
- Agúndez, M., Molpeceres, G., Cabezas, C., et al. 2025, A&A, 693, L20 [NASA ADS] [CrossRef] [EDP Sciences] [Google Scholar]
- Alexander, C. M. O., Fogel, M. L., Yabuta, H., & Cody, G. D. 2007, GCA, 71, 4380 [Google Scholar]
- Alexander, C. M. O., Newsome, S. D., Fogel, M. L., et al. 2010, GCA, 74, 4417 [Google Scholar]
- Alexander, C. M. O., Bowden, R., Fogel, M. L., et al. 2012, Science, 337, 721 [NASA ADS] [CrossRef] [Google Scholar]
- Alexander, C. M. O., McKeegan, K. D., & Altwegg, K. 2017, SSR, 212, 1151 [Google Scholar]
- Altwegg, K., Balsiger, H., Bar-Nun, A., et al. 2016, SA, 2, e1600285 [Google Scholar]
- Ambrose, H. E., Shirley, Y. L., & Scibelli, S. 2021, MNRAS, 501, 347 [Google Scholar]
- Appel, S. M., Burkhart, B., Semenov, V. A., et al. 2023, ApJ, 954, 93 [NASA ADS] [CrossRef] [Google Scholar]
- Arce, H. G., Santiago-García, J., Jørgensen, J. K., Tafalla, M., & Bachiller, R. 2008, ApJ, 681, L21 [NASA ADS] [CrossRef] [Google Scholar]
- Arzoumanian, D., Arakawa, S., Kobayashi, M. I. N., et al. 2023, ApJ, 947, L29 [Google Scholar]
- Bally, J. 2011, in Computational Star Formation, eds. 270, J. Alves, B. G. Elmegreen, J. M. Girart, & V. Trimble, 247 [Google Scholar]
- Barnes, A. T., Kong, S., Tan, J. C., et al. 2016, MNRAS, 458, 1990 [NASA ADS] [CrossRef] [Google Scholar]
- Barnes, A. T., Henshaw, J. D., Fontani, F., et al. 2021, MNRAS, 503, 4601 [CrossRef] [Google Scholar]
- Barnes, A. T., Liu, J., Zhang, Q., et al. 2023, A&A, 675, A53 [NASA ADS] [CrossRef] [EDP Sciences] [Google Scholar]
- Beattie, J. R., Kolborg, A. N., Ramirez-Ruiz, E., & Federrath, C. 2025, ApJ, 994, 193 [Google Scholar]
- Beuther, H., Bihr, S., Rugel, M., et al. 2016, A&A, 595, A32 [NASA ADS] [CrossRef] [EDP Sciences] [Google Scholar]
- Bhat, B., Kar, R., Mondal, S. K., et al. 2023, ApJ, 958, 111 [Google Scholar]
- Bianchi, E., Codella, C., Ceccarelli, C., et al. 2017, MNRAS, 467, 3011 [NASA ADS] [CrossRef] [Google Scholar]
- Bianchi, E., Codella, C., Ceccarelli, C., et al. 2019, MNRAS, 483, 1850 [Google Scholar]
- Biver, N., Bockelée-Morvan, D., Paubert, G., et al. 2019, A&A, 630, A19 [NASA ADS] [CrossRef] [EDP Sciences] [Google Scholar]
- Bizzocchi, L., Caselli, P., Spezzano, S., & Leonardo, E. 2014, A&A, 569, A27 [NASA ADS] [CrossRef] [EDP Sciences] [Google Scholar]
- Blake, G. A., Sutton, E. C., Masson, C. R., & Phillips, T. G. 1987, ApJ, 315, 621 [Google Scholar]
- Bockelée-Morvan, D., Lis, D. C., Wink, J. E., et al. 2000, A&A, 353, 1101 [Google Scholar]
- Boss, A. P., & Keiser, S. A. 2010, ApJ, 717, L1 [Google Scholar]
- Boss, A. P., & Keiser, S. A. 2013, ApJ, 776, 72 [Google Scholar]
- Bouscasse, L., Csengeri, T., Belloche, A., et al. 2022, A&A, 662, A32 [NASA ADS] [CrossRef] [EDP Sciences] [Google Scholar]
- Bovino, S., Lupi, A., Giannetti, A., et al. 2021, A&A, 654, A34 [NASA ADS] [CrossRef] [EDP Sciences] [Google Scholar]
- Brinkmann, N., Wyrowski, F., Kauffmann, J., et al. 2020, A&A, 636, A39 [NASA ADS] [CrossRef] [EDP Sciences] [Google Scholar]
- Brown, R. D., Crofts, J. G., Gardner, F. F., et al. 1975, ApJ, 197, L29 [NASA ADS] [CrossRef] [Google Scholar]
- Busemann, H., Young, A. F., Alexander, C. M. O., et al. 2006, Science, 312, 727 [NASA ADS] [CrossRef] [Google Scholar]
- Butler, M. J., & Tan, J. C. 2009, ApJ, 696, 484 [NASA ADS] [CrossRef] [Google Scholar]
- Butler, M. J., & Tan, J. C. 2012, ApJ, 754, 5 [Google Scholar]
- Cabezas, C., Agúndez, M., Marcelino, N., et al. 2021, A&A, 654, L9 [NASA ADS] [CrossRef] [EDP Sciences] [Google Scholar]
- Calcutt, H., Willis, E. R., Jørgensen, J. K., et al. 2019, A&A, 631, A137 [NASA ADS] [CrossRef] [EDP Sciences] [Google Scholar]
- Carey, S. J., Noriega-Crespo, A., Mizuno, D. R., et al. 2009, PASP, 121, 76 [Google Scholar]
- Caselli, P., Walmsley, C. M., Tafalla, M., Dore, L., & Myers, P. C. 1999, ApJ, 523, L165 [Google Scholar]
- Caselli, P., Vastel, C., Ceccarelli, C., et al. 2008, A&A, 492, 703 [NASA ADS] [CrossRef] [EDP Sciences] [Google Scholar]
- Cazaux, S., Tielens, A. G. G. M., Ceccarelli, C., et al. 2003, ApJ, 593, L51 [CrossRef] [Google Scholar]
- Ceccarelli, C., Caselli, P., Bockelée-Morvan, D., et al. 2014, PPTVI, 859 [Google Scholar]
- Ceccarelli, C., Codella, C., Balucani, N., et al. 2022, arXiv e-prints [arXiv:2206.13270] [Google Scholar]
- Cernicharo, J., Agúndez, M., Cabezas, C., et al. 2021, A&A, 649, L15 [EDP Sciences] [Google Scholar]
- Cheng, Y., Tan, J. C., Caselli, P., et al. 2021, ApJ, 916, 78 [NASA ADS] [CrossRef] [Google Scholar]
- Churchwell, E., Babler, B. L., Meade, M. R., et al. 2009, PASP, 121, 213 [Google Scholar]
- Codella, C., Benedettini, M., Beltrán, M. T., et al. 2009, A&A, 507, L25 [NASA ADS] [CrossRef] [EDP Sciences] [Google Scholar]
- Codella, C., Ceccarelli, C., Bianchi, E., et al. 2020, A&A, 635, A17 [NASA ADS] [CrossRef] [EDP Sciences] [Google Scholar]
- Coletta, A., Fontani, F., Rivilla, V. M., et al. 2020, A&A, 641, A54 [NASA ADS] [CrossRef] [EDP Sciences] [Google Scholar]
- Colzi, L., Martín-Pintado, J., Rivilla, V. M., et al. 2022, ApJ, 926, L22 [NASA ADS] [CrossRef] [Google Scholar]
- Cosentino, G., Jiménez-Serra, I., Henshaw, J. D., et al. 2018, MNRAS, 474, 3760 [NASA ADS] [Google Scholar]
- Cosentino, G., Jiménez-Serra, I., Caselli, P., et al. 2019, ApJ, 881, L42 [NASA ADS] [CrossRef] [Google Scholar]
- Cosentino, G., Jiménez-Serra, I., Tan, J. C., et al. 2022, MNRAS, 511, 953 [NASA ADS] [CrossRef] [Google Scholar]
- Cosentino, G., Tan, J. C., Jiménez-Serra, I., et al. 2023, A&A, 675, A190 [NASA ADS] [CrossRef] [EDP Sciences] [Google Scholar]
- Cosentino, G., Jiménez-Serra, I., Barnes, A. T., et al. 2025, A&A, 693, A199 [NASA ADS] [CrossRef] [EDP Sciences] [Google Scholar]
- Crapsi, A., Caselli, P., Walmsley, C. M., et al. 2005, ApJ, 619, 379 [Google Scholar]
- Crovisier, J., Bockelée-Morvan, D., Colom, P., Biver, N., & Bockelée-Morvan, D. 2004, Comets II, 273 [Google Scholar]
- Desch, S. J., Young, E. D., Dunham, E. T., Fujimoto, Y., & Dunlap, D. R. 2022, PPTVII, 759 [Google Scholar]
- Despois, D., Bockelée-Morvan, D., Crovisier, J., & Biver, N. 2005, BAAS, 37, 647 [Google Scholar]
- Drozdovskaya, M. N., Schroeder, I. R. H. G., Rubin, M., et al. 2021, MNRAS, 500, 4901 [Google Scholar]
- Emprechtinger, M., Caselli, P., Volgenau, N. H., Stutzki, J., & Wiedner, M. C. 2009, A&A, 493, 89 [NASA ADS] [CrossRef] [EDP Sciences] [Google Scholar]
- Endres, C. P., Schlemmer, S., Schilke, P., Stutzki, J., & Müller, H. S. P. 2016, JMS, 327, 95 [Google Scholar]
- Federrath, C., & Klessen, R. S. 2012, ApJ, 761, 156 [Google Scholar]
- Feng, S., Beuther, H., Henning, T., et al. 2015, A&A, 581, A71 [NASA ADS] [CrossRef] [EDP Sciences] [Google Scholar]
- Fontani, F., Cesaroni, R., Caselli, P., & Olmi, L. 2002, A&A, 389, 603 [NASA ADS] [CrossRef] [EDP Sciences] [Google Scholar]
- Fontani, F., Caselli, P., Crapsi, A., et al. 2006, A&A, 460, 709 [NASA ADS] [CrossRef] [EDP Sciences] [Google Scholar]
- Fontani, F., Palau, A., Caselli, P., et al. 2011, A&A, 529, L7 [NASA ADS] [CrossRef] [EDP Sciences] [Google Scholar]
- Fontani, F., Sakai, T., Furuya, K., et al. 2014, MNRAS, 440, 448 [NASA ADS] [CrossRef] [Google Scholar]
- Fontani, F., Busquet, G., Palau, A., et al. 2015, A&A, 575, A87 [NASA ADS] [CrossRef] [EDP Sciences] [Google Scholar]
- Fragile, P. C., Murray, S. D., & Lin, D. N. C. 2003, ApJ, 590, 778 [Google Scholar]
- Friesen, R. K., Kirk, H. M., & Shirley, Y. L. 2013, ApJ, 765, 59 [NASA ADS] [CrossRef] [Google Scholar]
- Gerner, T., Shirley, Y. L., Beuther, H., et al. 2015, A&A, 579, A80 [NASA ADS] [CrossRef] [EDP Sciences] [Google Scholar]
- Gorai, P., Law, C.-Y., Tan, J. C., et al. 2024, ApJ, 960, 127 [NASA ADS] [CrossRef] [Google Scholar]
- Gounelle, M., & Meynet, G. 2012, A&A, 545, A4 [NASA ADS] [CrossRef] [EDP Sciences] [Google Scholar]
- Gratier, P., Majumdar, L., Ohishi, M., et al. 2016, ApJS, 225, 25 [Google Scholar]
- Herbst, E., & van Dishoeck, E. F. 2009, ARA&A, 47, 427 [Google Scholar]
- Hernandez, A. K., & Tan, J. C. 2015, ApJ, 809, 154 [NASA ADS] [CrossRef] [Google Scholar]
- Hirota, T., Ikeda, M., & Yamamoto, S. 2001, ApJ, 547, 814 [NASA ADS] [CrossRef] [Google Scholar]
- Hogge, T. G., Jackson, J. M., Allingham, D., et al. 2019, ApJ, 887, 79 [NASA ADS] [CrossRef] [Google Scholar]
- Holdship, J., Viti, S., Codella, C., et al. 2019, ApJ, 880, 138 [NASA ADS] [CrossRef] [Google Scholar]
- Imai, M., Furuya, K., & Aikawa, Y. 2018, ApJ, 869, 34 [Google Scholar]
- Inoue, T., Hennebelle, P., Fukui, Y., et al. 2018, PASJ, 70, S53 [NASA ADS] [Google Scholar]
- Jiménez-Serra, I., Vasyunin, A. I., Caselli, P., et al. 2016, ApJ, 830, L6 [Google Scholar]
- Jiménez-Serra, I., Vasyunin, A. I., Spezzano, S., et al. 2021, ApJ, 917, 44 [CrossRef] [Google Scholar]
- Jørgensen, J. K., Hogerheijde, M. R., Blake, G. A., et al. 2004, A&A, 415, 1021 [NASA ADS] [CrossRef] [EDP Sciences] [Google Scholar]
- Kainulainen, J., & Tan, J. C. 2013, A&A, 549, A53 [NASA ADS] [CrossRef] [EDP Sciences] [Google Scholar]
- Khullar, S., Matzner, C. D., Murray, N., et al. 2024, ApJ, 973, 40 [NASA ADS] [CrossRef] [Google Scholar]
- Kolesniková, L., Tercero, B., Cernicharo, J., et al. 2014, ApJ, 784, L7 [Google Scholar]
- Kong, S., Tan, J. C., Caselli, P., et al. 2016, ApJ, 821, 94 [NASA ADS] [CrossRef] [Google Scholar]
- Le Roy, L., Altwegg, K., Balsiger, H., et al. 2015, A&A, 583, A1 [NASA ADS] [CrossRef] [EDP Sciences] [Google Scholar]
- Lee, Y.-H., Koo, B.-C., & Lee, J.-J. 2020, AJ, 160, 263 [NASA ADS] [CrossRef] [Google Scholar]
- Leitherer, C., Schaerer, D., Goldader, J. D., et al. 1999, ApJS, 123, 3 [Google Scholar]
- Lellouch, E., Bézard, B., Fouchet, T., et al. 2001, A&A, 370, 610 [CrossRef] [EDP Sciences] [Google Scholar]
- Li, S., Frank, A., Blackman, E. G., et al. 2014, ApJ, 789, 10 [NASA ADS] [CrossRef] [Google Scholar]
- Lis, D. C., Gerin, M., Phillips, T. G., & Motte, F. 2002, ApJ, 569, 322 [NASA ADS] [CrossRef] [Google Scholar]
- Lis, D. C., Wootten, H. A., Gerin, M., et al. 2016, ApJ, 827, 133 [NASA ADS] [CrossRef] [Google Scholar]
- López-Gallifa, Á., Rivilla, V. M., Beltrán, M. T., et al. 2024, MNRAS, 529, 3244 [CrossRef] [Google Scholar]
- López-Sepulcre, A., Codella, C., Ceccarelli, C., Podio, L., & Robuschi, J. 2024, A&A, 692, A120 [NASA ADS] [CrossRef] [EDP Sciences] [Google Scholar]
- Manigand, S., Calcutt, H., Jørgensen, J. K., et al. 2019, A&A, 623, A69 [NASA ADS] [CrossRef] [EDP Sciences] [Google Scholar]
- Marcelino, N., Agúndez, M., Tercero, B., et al. 2020, A&A, 643, L6 [NASA ADS] [CrossRef] [EDP Sciences] [Google Scholar]
- Martín, S., Martin-Pintado, J., Blanco-Sánchez, C., et al. 2019, A&A, 631, A159 [NASA ADS] [CrossRef] [EDP Sciences] [Google Scholar]
- Martín-Doménech, R., Bergner, J. B., Öberg, K. I., et al. 2021, ApJ, 923, 155 [CrossRef] [Google Scholar]
- Mauersberger, R., Henkel, C., Walmsley, C. M., Sage, L. J., & Wiklind, T. 1991, A&A, 247, 307 [NASA ADS] [Google Scholar]
- Megias, A., Jiménez-Serra, I., Martin-Pintado, J., et al. 2023, MNRAS, 519, 1601 [Google Scholar]
- Meier, R., Owen, T. C., Matthews, H. E., et al. 1998, Science, 279, 1707 [Google Scholar]
- Mininni, C., Fontani, F., Sánchez-Monge, A., et al. 2021, A&A, 653, A87 [NASA ADS] [CrossRef] [EDP Sciences] [Google Scholar]
- Mininni, C., Beltrán, M. T., Colzi, L., et al. 2023, A&A, 677, A15 [NASA ADS] [CrossRef] [EDP Sciences] [Google Scholar]
- Molinari, S., Swinyard, B., Bally, J., et al. 2010, PASP, 122, 314 [Google Scholar]
- Öberg, K. I., Facchini, S., & Anderson, D. E. 2023, ARA&A, 61, 287 [Google Scholar]
- Oliveira, C. M., Hébrard, G., Howk, J. C., et al. 2003, ApJ, 587, 235 [NASA ADS] [CrossRef] [Google Scholar]
- Ouellette, N., Desch, S. J., & Hester, J. J. 2007, ApJ, 662, 1268 [NASA ADS] [CrossRef] [Google Scholar]
- Ouellette, N., Desch, S. J., & Hester, J. J. 2009, GCA, 73, 4946 [Google Scholar]
- Parise, B., Castets, A., Herbst, E., et al. 2004, A&A, 416, 159 [NASA ADS] [CrossRef] [EDP Sciences] [Google Scholar]
- Parker, R. J., Lichtenberg, T., Patel, M., Polius, C. K. M., & Ridsdill-Smith, M. 2023, MNRAS, 521, 4838 [Google Scholar]
- Paron, S., Ortega, M. E., Rubio, M., & Dubner, G. 2009, A&A, 498, 445 [NASA ADS] [CrossRef] [EDP Sciences] [Google Scholar]
- Petrashkevich, I. V., Punanova, A. F., Caselli, P., et al. 2024, MNRAS, 528, 1327 [Google Scholar]
- Pfalzner, S., Davies, M., Gounelle, M., et al. 2015, Phys. Scr., 90, 068001 [NASA ADS] [CrossRef] [Google Scholar]
- Pickett, H. M., Poynter, R. L., Cohen, E. A., et al. 1998, J. Quant. Spec. Radiat. Transf., 60, 883 [Google Scholar]
- Qiu, J., Zhang, J., Zhang, Y., Jia, L., & Tang, X. 2020, A&A, 634, A125 [NASA ADS] [CrossRef] [EDP Sciences] [Google Scholar]
- Rathborne, J. M., Jackson, J. M., & Simon, R. 2006, ApJ, 641, 389 [Google Scholar]
- Reach, W. T., Tram, L. N., DeWitt, C., et al. 2024, ApJ, 977, 149 [Google Scholar]
- Redaelli, E., Bizzocchi, L., Caselli, P., et al. 2019, A&A, 629, A15 [NASA ADS] [CrossRef] [EDP Sciences] [Google Scholar]
- Remusat, L., Robert, F., Meibom, A., Binet, L., & Gourier, D. 2006, PNAS, 103, 17462 [Google Scholar]
- Robert, F. 2003, Space Sci. Rev., 106, 87 [NASA ADS] [CrossRef] [Google Scholar]
- Romero-Mirza, C. E., Oberg, K., Law, C., & Teague, R. 2022, in BAAS, 54, 102.108 [Google Scholar]
- Sabatini, G., Giannetti, A., Bovino, S., et al. 2019, MNRAS, 490, 4489 [Google Scholar]
- Sano, H., Inoue, T., Tokuda, K., et al. 2020, ApJ, 904, L24 [NASA ADS] [CrossRef] [Google Scholar]
- Sano, H., Yamane, Y., van Loon, J. T., et al. 2023, ApJ, 958, 53 [NASA ADS] [CrossRef] [Google Scholar]
- Sashida, T., Oka, T., Tanaka, K., et al. 2013, ApJ, 774, 10 [NASA ADS] [CrossRef] [Google Scholar]
- Scibelli, S., Shirley, Y., Vasyunin, A., & Launhardt, R. 2021, MNRAS, 504, 5754 [NASA ADS] [CrossRef] [Google Scholar]
- Scibelli, S., Shirley, Y., Megias, A., & Jiménez-Serra, I. 2024, MNRAS, 533, 4104 [Google Scholar]
- Skrutskie, M. F., Cutri, R. M., Stiening, R., et al. 2006, AJ, 131, 1163 [NASA ADS] [CrossRef] [Google Scholar]
- Taniguchi, K., Saito, M., Majumdar, L., et al. 2018, ApJ, 866, 150 [NASA ADS] [CrossRef] [Google Scholar]
- Thiel, V., Belloche, A., Menten, K. M., Garrod, R. T., & Müller, H. S. P. 2017, A&A, 605, L6 [NASA ADS] [CrossRef] [EDP Sciences] [Google Scholar]
- van Gelder, M. L., Tabone, B., Hogerheijde, M. R., et al. 2021, A&A, 653, A159 [CrossRef] [EDP Sciences] [Google Scholar]
- van Gelder, M. L., Tabone, B., Hogerheijde, M. R., et al. 2022, A&A, 659, A186 [NASA ADS] [CrossRef] [EDP Sciences] [Google Scholar]
- Vastel, C., Ceccarelli, C., Lefloch, B., & Bachiller, R. 2014, ApJ, 795, L2 [NASA ADS] [CrossRef] [Google Scholar]
- Vastel, C., Loison, J. C., Wakelam, V., & Lefloch, B. 2019, A&A, 625, A91 [NASA ADS] [CrossRef] [EDP Sciences] [Google Scholar]
- Vasyunina, T., Vasyunin, A. I., Herbst, E., et al. 2014, ApJ, 780, 85 [Google Scholar]
- Walmsley, C. M., & Ungerechts, H. 1983, A&A, 122, 164 [Google Scholar]
- Walsh, C., Millar, T. J., Nomura, H., et al. 2014, A&A, 563, A33 [NASA ADS] [CrossRef] [EDP Sciences] [Google Scholar]
- Yang, K., Wang, J., Qiu, K., & Zhang, T. 2024, ApJS, 270, 35 [NASA ADS] [CrossRef] [Google Scholar]
- Young, E. D. 2014, Earth Planet. Sci. Lett., 392, 16 [Google Scholar]
- Zeng, S., Jiménez-Serra, I., Cosentino, G., et al. 2017, A&A, 603, A22 [NASA ADS] [CrossRef] [EDP Sciences] [Google Scholar]
- Zeng, S., Jiménez-Serra, I., Rivilla, V. M., et al. 2018, MNRAS, 478, 2962 [Google Scholar]
- Zhou, Y., Xu, J.-L., Li, D., Li, H.-B., & Wang, J.-J. 2021, A&A, 654, A19 [NASA ADS] [CrossRef] [EDP Sciences] [Google Scholar]
- Zhou, C., Vastel, C., Montillaud, J., et al. 2022, A&A, 658, A131 [NASA ADS] [CrossRef] [EDP Sciences] [Google Scholar]
Madrid Data Cube Analysis on ImageJ is a software developed at the Center of Astrobiology (CAB) in Madrid; https://cab.inta-csic.es/madcuba/
We consider a linewidth of 3 km s−1, typical of the detected species, and estimate the integrated noise as Arms=rms×δv×√Nch, where rms is the spectral noise, δv is the velocity resolution, and Nch ∼ 4–6 is the number of channels within the 3 km s−1 linewidth.
Appendix A List of detected species
Molecular species, transition, frequency, Aul, Elow, integrated intensity, central velocity, linewidth, and signal-to-noise ratio of all the detected transitions of interest.
Appendix B Spectra of detected species
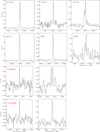 |
Fig. B.1 Spectra of detected D-bearing species and their H-bearing counterparts. For clarity, we only indicate the species. The quantum numbers for each transition are reported in Table A.1. |
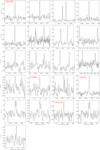 |
Fig. B.2 Spectra of detected COMs. For clarity, we only indicate the species. The quantum numbers for each transition are reported in Table A.1. |
All Tables
Telescope, frequency ranges, rms noise (Tmb), velocity resolution, and beam aperture of the observations presented in this work.
Molecular species, total column density, excitation temperature, molecular abundance with respect to H2, deuterium fractionation values, and COM abundances with respect to CH3OH obtained for all the species of interest.
Molecular species, transition, frequency, Aul, Elow, integrated intensity, central velocity, linewidth, and signal-to-noise ratio of all the detected transitions of interest.
All Figures
|
Fig. 1 Top left : three colour image of G34.77. Red is 24 μm emission from the MIPSGAL survey (Carey et al. 2009), green is 8 μm emission from the GLIMPSE survey (Churchwell et al. 2009), and blue is 1 GHz continuum emission from the THOR survey (Beuther et al. 2016). Top right : mass surface density map (colour scale; Kainulainen & Tan 2013) with the red circle indicating the location of the Clump. Bottom panels : zoom-in views of the Clump at 2 μm (2MASS; Skrutskie et al. 2006), 8 μm (Carey et al. 2009), 24 μm (Churchwell et al. 2009), and 70 μm (Hi-GAL Molinari et al. 2010) emission. The cyan contours correspond to a mass surface density value of 0.3 g cm−2. In all panels, the magenta contour corresponds to a mass surface density of 0.1 g cm−2 and highlights the cloud outskirts. The red circle size corresponds to 44″, i.e. the largest beam size in the Yebes-40m observations. |
| In the text | |
|
Fig. 2 Rotational diagrams obtained using MADCUBA for 13CH3OH, CH3CCH, CH3CHO, CH3CN, and CH3SH. Magenta empty squares indicate the data points, while the green lines show the best fitting found by MADCUBA. In all panels, the corresponding species is indicated together with the inferred excitation temperature, Tex, and total column density, Ntot. |
| In the text | |
|
Fig. 3 D/H ratios measured from DCO+, DNC, DCN, and CH2DOH towards the Clump (dashed black lines and grey shadows) compared with literature values across low-mass starless and pre-stellar cores and low-mass protostars, high-mass IR-dark clumps, high-mass protostellar objects, and comets. For reference, we report the cosmic D/H ratio (dotted-dashed black line; Oliveira et al. 2003) and the D/H measured in meteorites (red shadow) and proto-solar nebula (dotted cyan line). |
| In the text | |
|
Fig. 4 Comparison between COM abundances with respect to CH3OH measured towards the Clump and literature values towards L1544 (LMPSC; Vastel et al. 2014; Bizzocchi et al. 2014; Jiménez-Serra et al. 2016; Vastel et al. 2019), TMC-1 (dark clouds; Gratier et al. 2016; Cabezas et al. 2021; Agúndez et al. 2025), I00117-MM2 and G11.11 (high-mass cores and/or IRDCs; Vasyunina et al. 2014; Fontani et al. 2015; Mininni et al. 2021), IRAS 16293B (hot corino) and G32.41+0.31 (hot core; Mininni et al. 2023; López-Gallifa et al. 2024), and the comets 67P∕Churyumov-Gerasimenko and Hale-Bopp (Bockelée-Morvan et al. 2000; Le Roy et al. 2015; Altwegg et al. 2016). The colours are representative of the environment: orange and dark orange for low-mass cores and dark clouds, green and dark green for massive cores/IRDCs, blue and dark blue for more evolved hot cores and corinos, and pink and purple for comets. |
| In the text | |
|
Fig. B.1 Spectra of detected D-bearing species and their H-bearing counterparts. For clarity, we only indicate the species. The quantum numbers for each transition are reported in Table A.1. |
| In the text | |
|
Fig. B.2 Spectra of detected COMs. For clarity, we only indicate the species. The quantum numbers for each transition are reported in Table A.1. |
| In the text | |
Current usage metrics show cumulative count of Article Views (full-text article views including HTML views, PDF and ePub downloads, according to the available data) and Abstracts Views on Vision4Press platform.
Data correspond to usage on the plateform after 2015. The current usage metrics is available 48-96 hours after online publication and is updated daily on week days.
Initial download of the metrics may take a while.