Open Access
Fig. 1.
Download original image
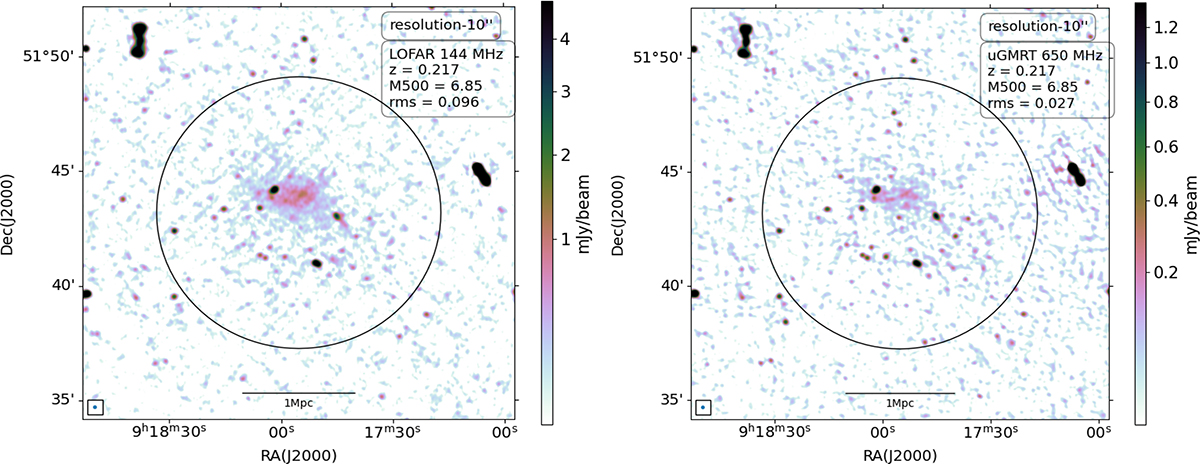
Left: High-resolution LOFAR image of A773 at 144 MHz. Right: High-resolution uGMRT image of A773 at 650 MHz. Both images have resolutions of 10′′ × 10′′, with M500 in units of 1014 M⊙ and rms in mJy/beam. The drawn region represents the r500 scale of the cluster.
Current usage metrics show cumulative count of Article Views (full-text article views including HTML views, PDF and ePub downloads, according to the available data) and Abstracts Views on Vision4Press platform.
Data correspond to usage on the plateform after 2015. The current usage metrics is available 48-96 hours after online publication and is updated daily on week days.
Initial download of the metrics may take a while.