Fig. D.1.
Download original image
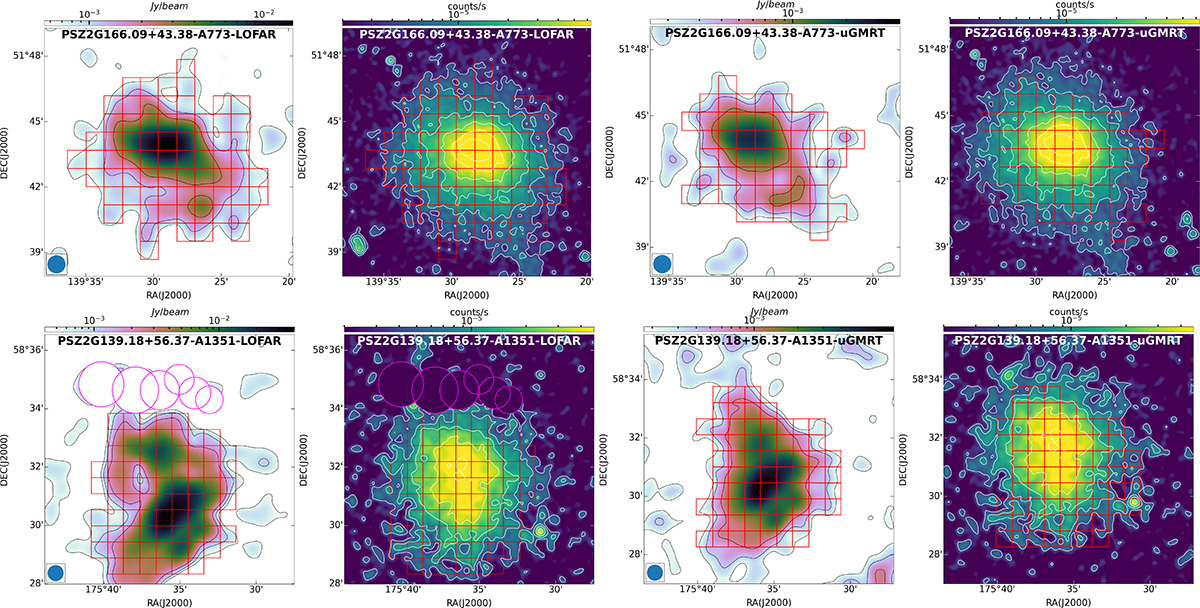
Top-left panels: LOFAR source-subtracted image of A773 at a resolution of 50″×50″ compared with an X-ray XMM image. Top-right panels: uGMRT source-subtracted image of A773 at a resolution of 50″×50″ compared with an X-ray XMM image. Bottom-left panels: LOFAR source-subtracted image of A1351 at a resolution of 33″×33″ compared with an X-ray XMM image. Bottom-right panels: uGMRT source-subtracted image of A1351 at a resolution of 33″×33″ compared with an X-ray XMM image. The boxes indicate the corresponding regions where radio and X-ray brightness were compared, and the circles indicate the masked regions in radio and X-ray images.
Current usage metrics show cumulative count of Article Views (full-text article views including HTML views, PDF and ePub downloads, according to the available data) and Abstracts Views on Vision4Press platform.
Data correspond to usage on the plateform after 2015. The current usage metrics is available 48-96 hours after online publication and is updated daily on week days.
Initial download of the metrics may take a while.