Open Access
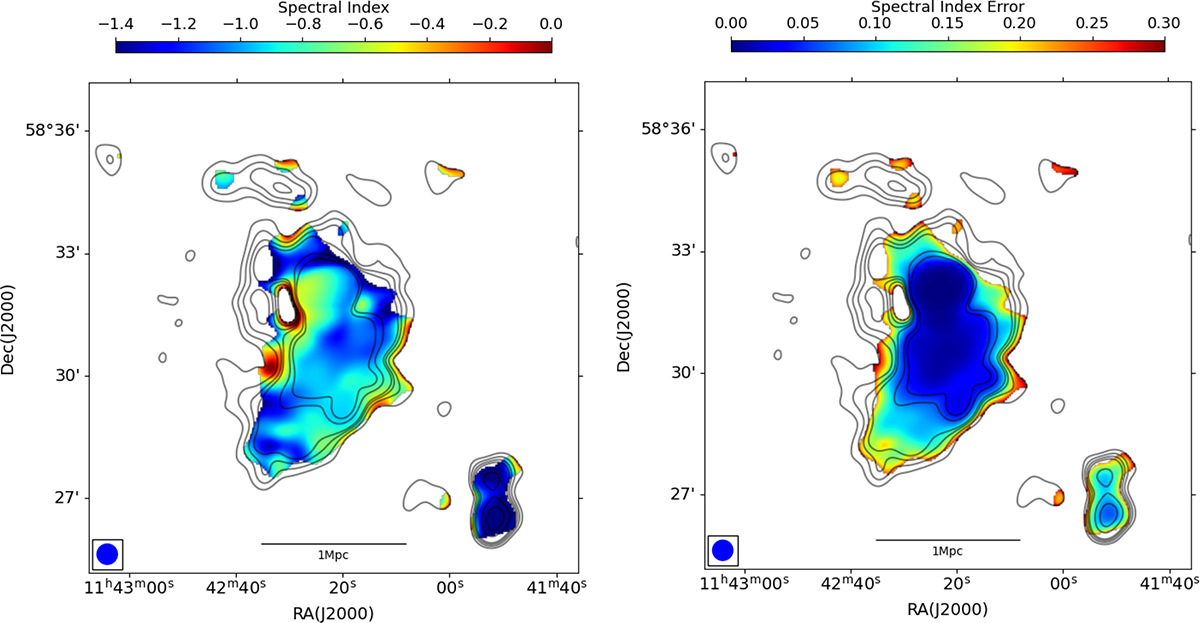
Fig. 7.
Download original image
Similar to Fig. 5 but for A1351, with resolutions of 30′′ × 30′′. The contour levels for LOFAR are set at (3, 6, 9, 12, 27, 41) × σrms, where σrms is 0.19 mJy/beam. Note that the BCG, TG, and the ridge were not subtracted in the final source-subtracted LOFAR and uGMRT images used to generate the spectral index map.
Current usage metrics show cumulative count of Article Views (full-text article views including HTML views, PDF and ePub downloads, according to the available data) and Abstracts Views on Vision4Press platform.
Data correspond to usage on the plateform after 2015. The current usage metrics is available 48-96 hours after online publication and is updated daily on week days.
Initial download of the metrics may take a while.