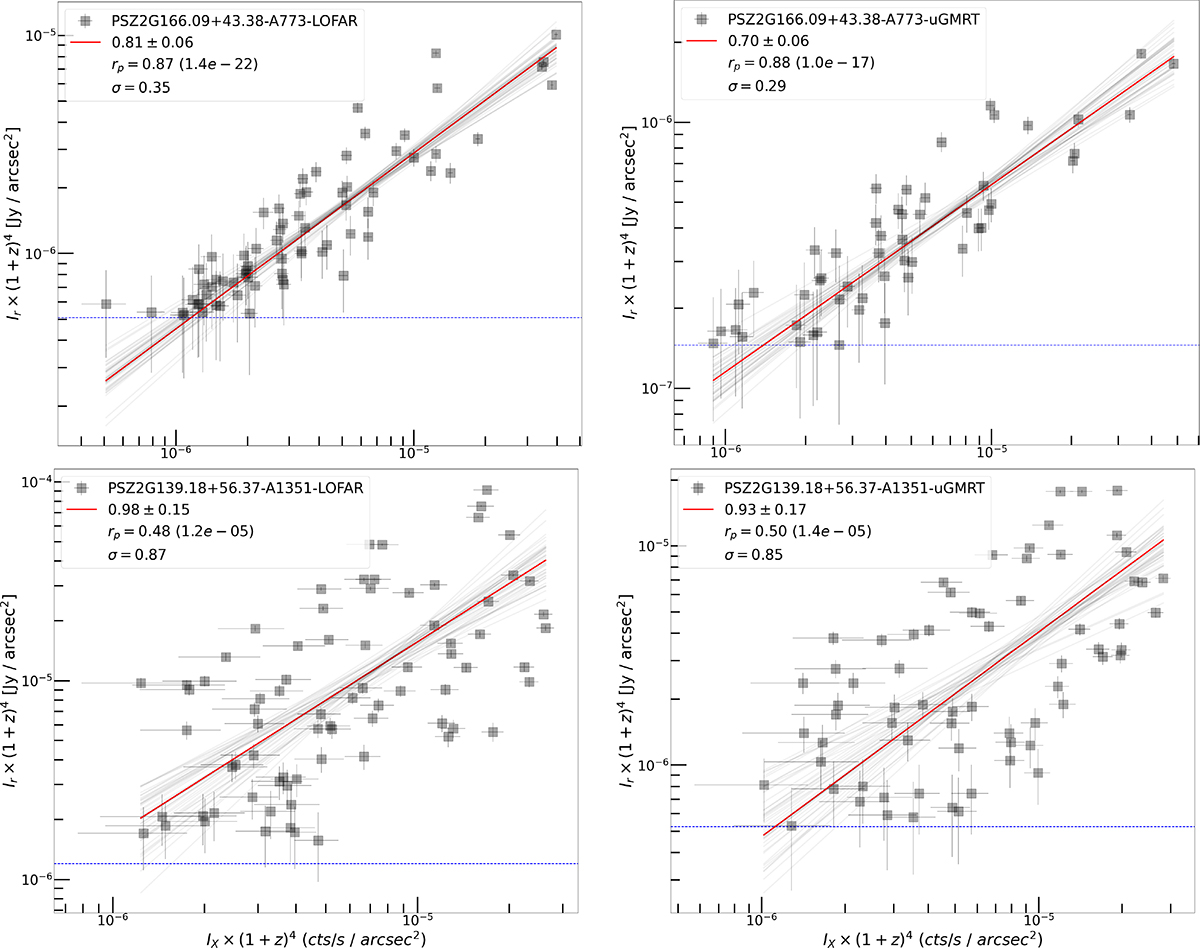
Fig. 8.
Download original image
Top: Radio and X-ray surface brightness comparison of LOFAR and uGMRT images at a resolution of 50′′ × 50′′ with an X-ray XMM image of A773 within the regions marked by boxes in Fig. D.1. Bottom: Same but for A1351 at a 33′′ × 33′′ resolution. The red line indicates the best fit, and the dashed blue line is the 2σ contour threshold. The Pearson correlation coefficient is denoted by rp, with the corresponding p-values in brackets. σ indicates the scatter around the best-fit relation.
Current usage metrics show cumulative count of Article Views (full-text article views including HTML views, PDF and ePub downloads, according to the available data) and Abstracts Views on Vision4Press platform.
Data correspond to usage on the plateform after 2015. The current usage metrics is available 48-96 hours after online publication and is updated daily on week days.
Initial download of the metrics may take a while.