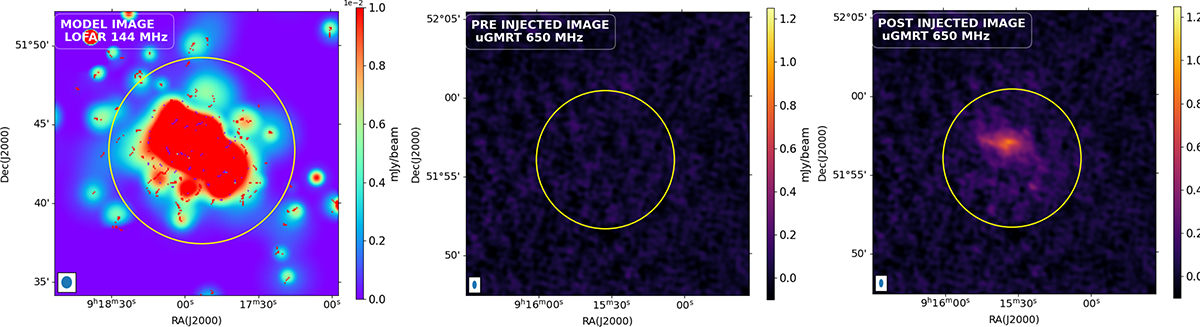
Fig. B.1.
Download original image
Real LOFAR model injection into a uGMRT image. Left: LOFAR source-subtracted model image tapered at 100 kpc (144 MHz), with the yellow region indicating the area chosen for injection. Middle: uGMRT source-subtracted image (650 MHz) before injection at the designated RA and Dec. Right: uGMRT source-subtracted image after injection of the LOFAR model rescaled at 650 MHz with α = −1, with the yellow region representing the size of the halo recovered after the injection.
Current usage metrics show cumulative count of Article Views (full-text article views including HTML views, PDF and ePub downloads, according to the available data) and Abstracts Views on Vision4Press platform.
Data correspond to usage on the plateform after 2015. The current usage metrics is available 48-96 hours after online publication and is updated daily on week days.
Initial download of the metrics may take a while.