Open Access
Fig. 10
Download original image
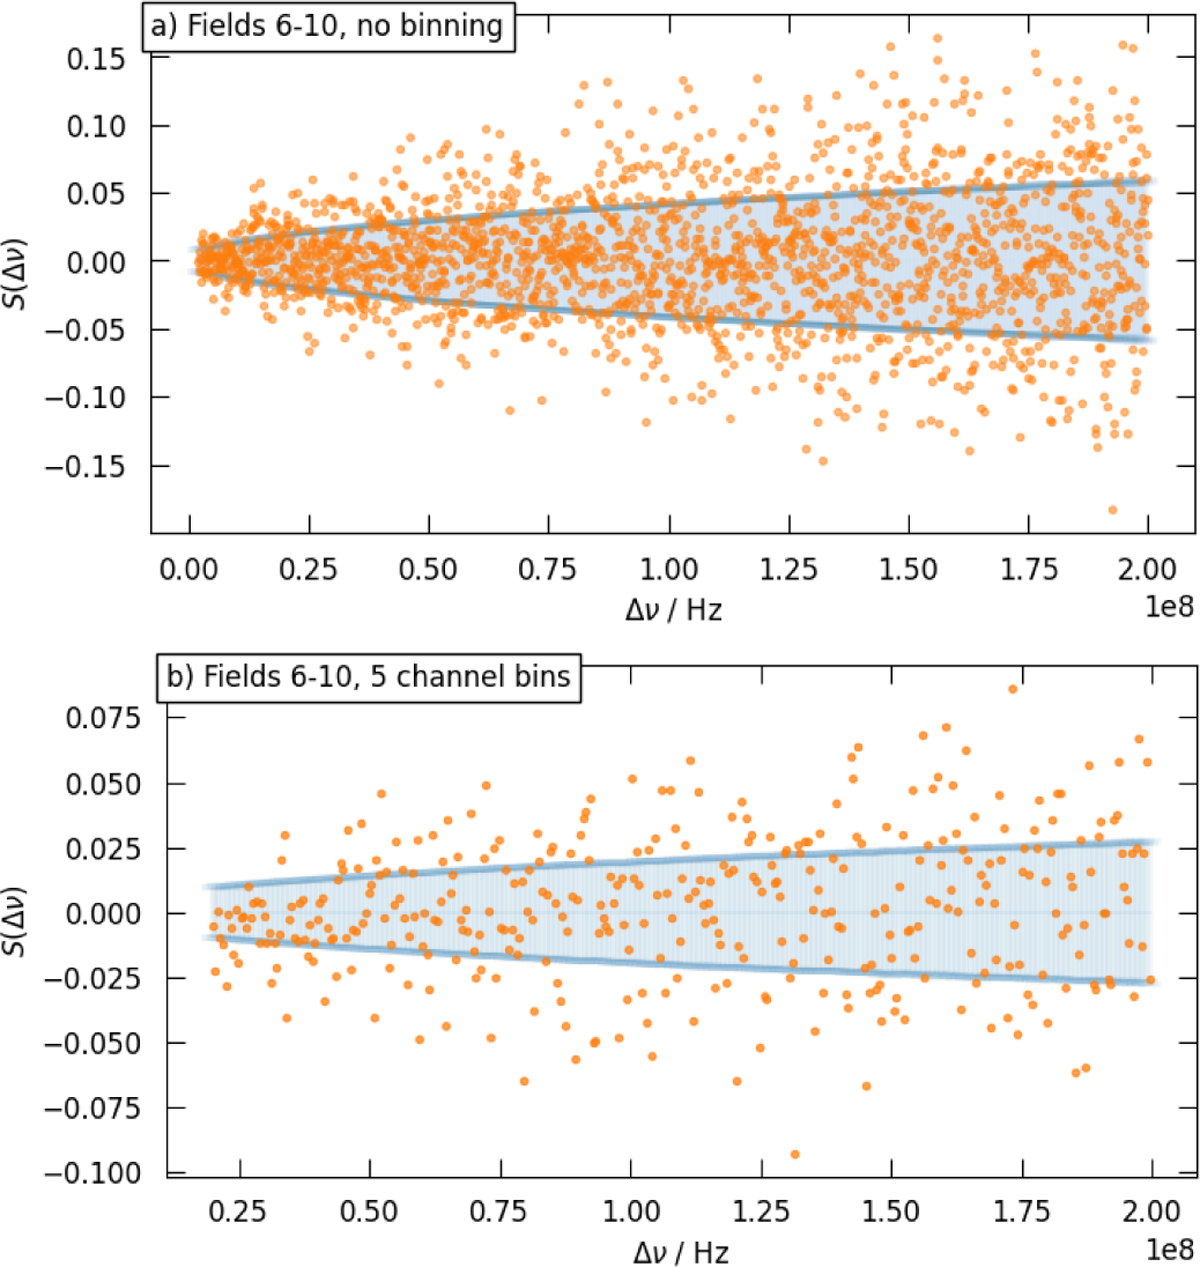
Power S(δb) across a continuous range of combs with line intervals ∆ν. The top panel is for the raw spectral resolution, and the lower panel uses a five-channel average. Uncertainties are shown as vertical ±1σ error bars in blue (with total length of 2σ), and are offset to zero for clarity.
Current usage metrics show cumulative count of Article Views (full-text article views including HTML views, PDF and ePub downloads, according to the available data) and Abstracts Views on Vision4Press platform.
Data correspond to usage on the plateform after 2015. The current usage metrics is available 48-96 hours after online publication and is updated daily on week days.
Initial download of the metrics may take a while.