Fig. 5
Download original image
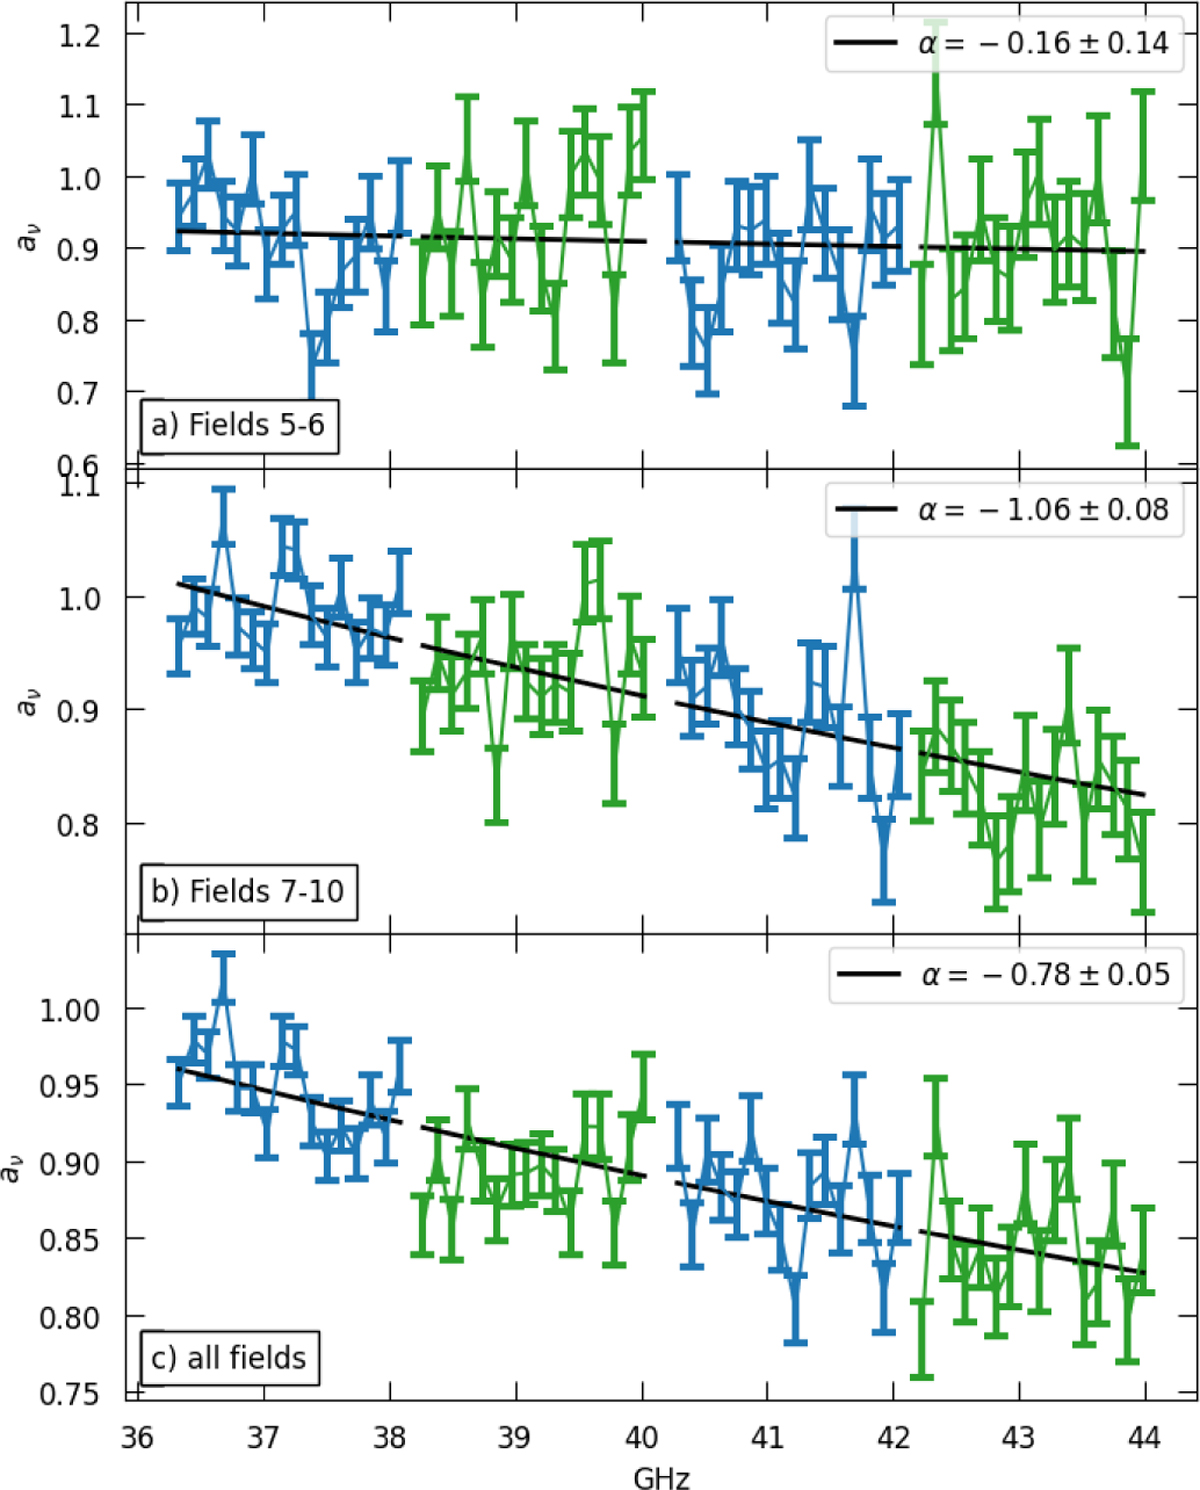
Spectrum of the diffuse emission from ρ Oph W, as estimated with the cross-correlation slope, aν. The black line is the best-fit powerlaw spectrum, with spectral index indicated in the legends. Plots a-c correspond to spectra extracted over different parts of the mosaic, as indicated in each plot. Field IDs follow from Fig. 1. Spectral windows are plotted in alternating colours.
Current usage metrics show cumulative count of Article Views (full-text article views including HTML views, PDF and ePub downloads, according to the available data) and Abstracts Views on Vision4Press platform.
Data correspond to usage on the plateform after 2015. The current usage metrics is available 48-96 hours after online publication and is updated daily on week days.
Initial download of the metrics may take a while.