Open Access
Fig. 6
Download original image
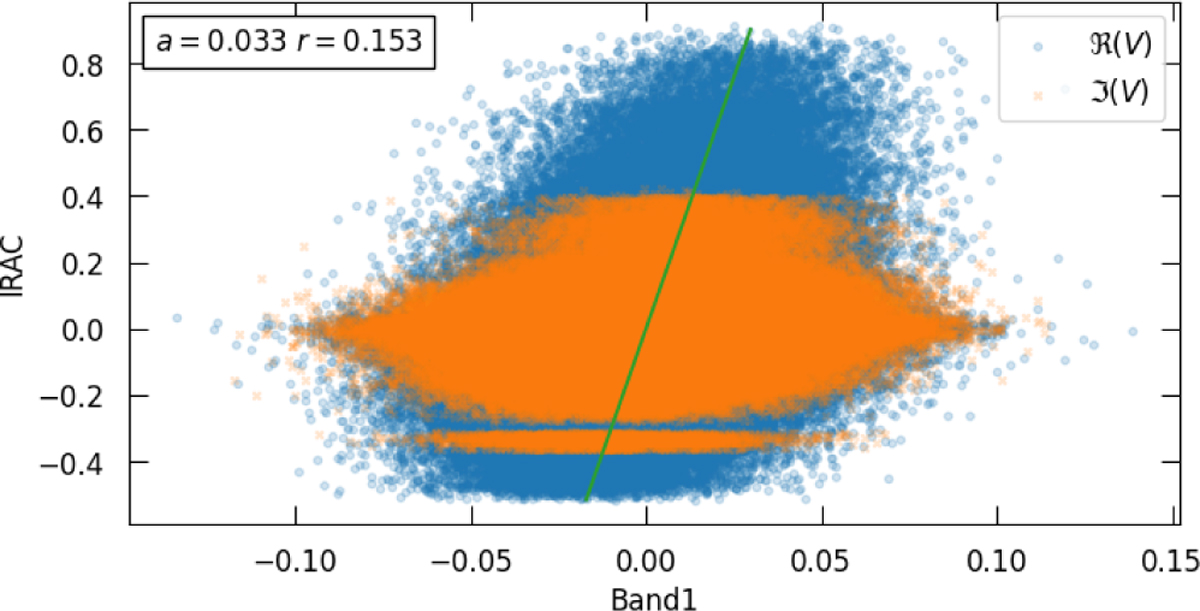
Radio-IR linear regression in real and imaginary parts, with Band 1 visibilities on the x-axis, and simulated IRAC 3.6 μm visibilities on the y-axis. Axis units are given in Jy. Only data corresponding to uv-radii shorter than 2606λ have been selected. The green line corresponds to the best fit linear regression.
Current usage metrics show cumulative count of Article Views (full-text article views including HTML views, PDF and ePub downloads, according to the available data) and Abstracts Views on Vision4Press platform.
Data correspond to usage on the plateform after 2015. The current usage metrics is available 48-96 hours after online publication and is updated daily on week days.
Initial download of the metrics may take a while.