Fig. 8
Download original image
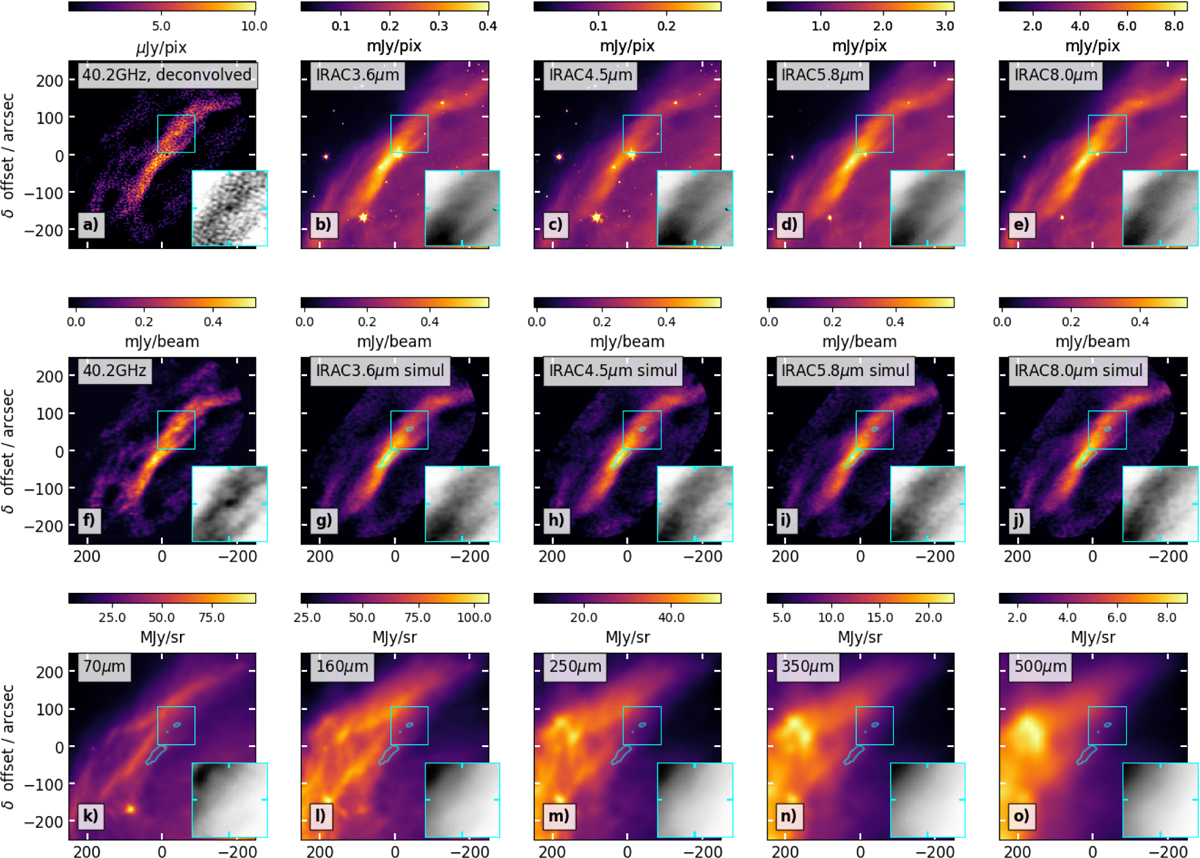
Comparison of the ALMA Band 1 with IR templates. Insets highlight the compact EME source at J2000 RA 16:25:54.154, Dec −24:19:52.5. The blue contour traces the Band 1 image from Fig. 1a at 80% peak. (a) Band 1 deconvolved image (same as Fig. 1c, but with λ = 0.1 for comparison). (b-e) IRAC images, with 1″ pixels, and before point-source subtraction. (f) Restored Band 1 image (same as Fig. 1a, but with λ = 0.1). (g-j) Restorations of the IRAC simulations, after point-source subtraction, scaling by aIR, and addition of thermal noise, as in the Band 1 data. (k-o) Herschel images.
Current usage metrics show cumulative count of Article Views (full-text article views including HTML views, PDF and ePub downloads, according to the available data) and Abstracts Views on Vision4Press platform.
Data correspond to usage on the plateform after 2015. The current usage metrics is available 48-96 hours after online publication and is updated daily on week days.
Initial download of the metrics may take a while.