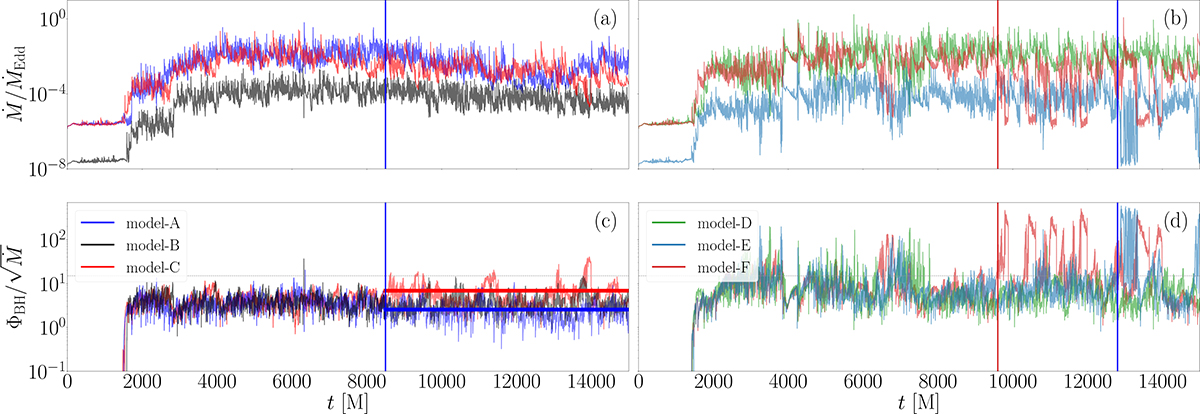
Fig. 1.
Download original image
Time evolution of mass accretion rates measured at the event horizon (top) and the normalized magnetic flux at the horizon (bottom). Panels (a) and (c): Case with smaller magnetic loops (λ = 40). Panels (b) and (d): Case with larger magnetic loops (λ = 80). The curves in different colors correspond to the different radiative cooling and time-averaged accretion rates: radiative cooling with Ṁ/ṀEdd = 1 × 10⁻³ (blue and green), radiative cooling with 1 × 10⁻⁵(black and light blue), and no cooling (red and light red). In panel (c), the horizontal red and blue lines denote the average magnetic flux of models A and C, respectively. The blue vertical lines in panels (a) and (c) mark the onset of the quasi-steady state. In panels (b) and (d), the light blue and light red vertical lines indicate the transition from SANE to MAD for models E and F, respectively. The time is given in units of the light crossing time, tg ≡ GM/c3 = [M].
Current usage metrics show cumulative count of Article Views (full-text article views including HTML views, PDF and ePub downloads, according to the available data) and Abstracts Views on Vision4Press platform.
Data correspond to usage on the plateform after 2015. The current usage metrics is available 48-96 hours after online publication and is updated daily on week days.
Initial download of the metrics may take a while.