Open Access
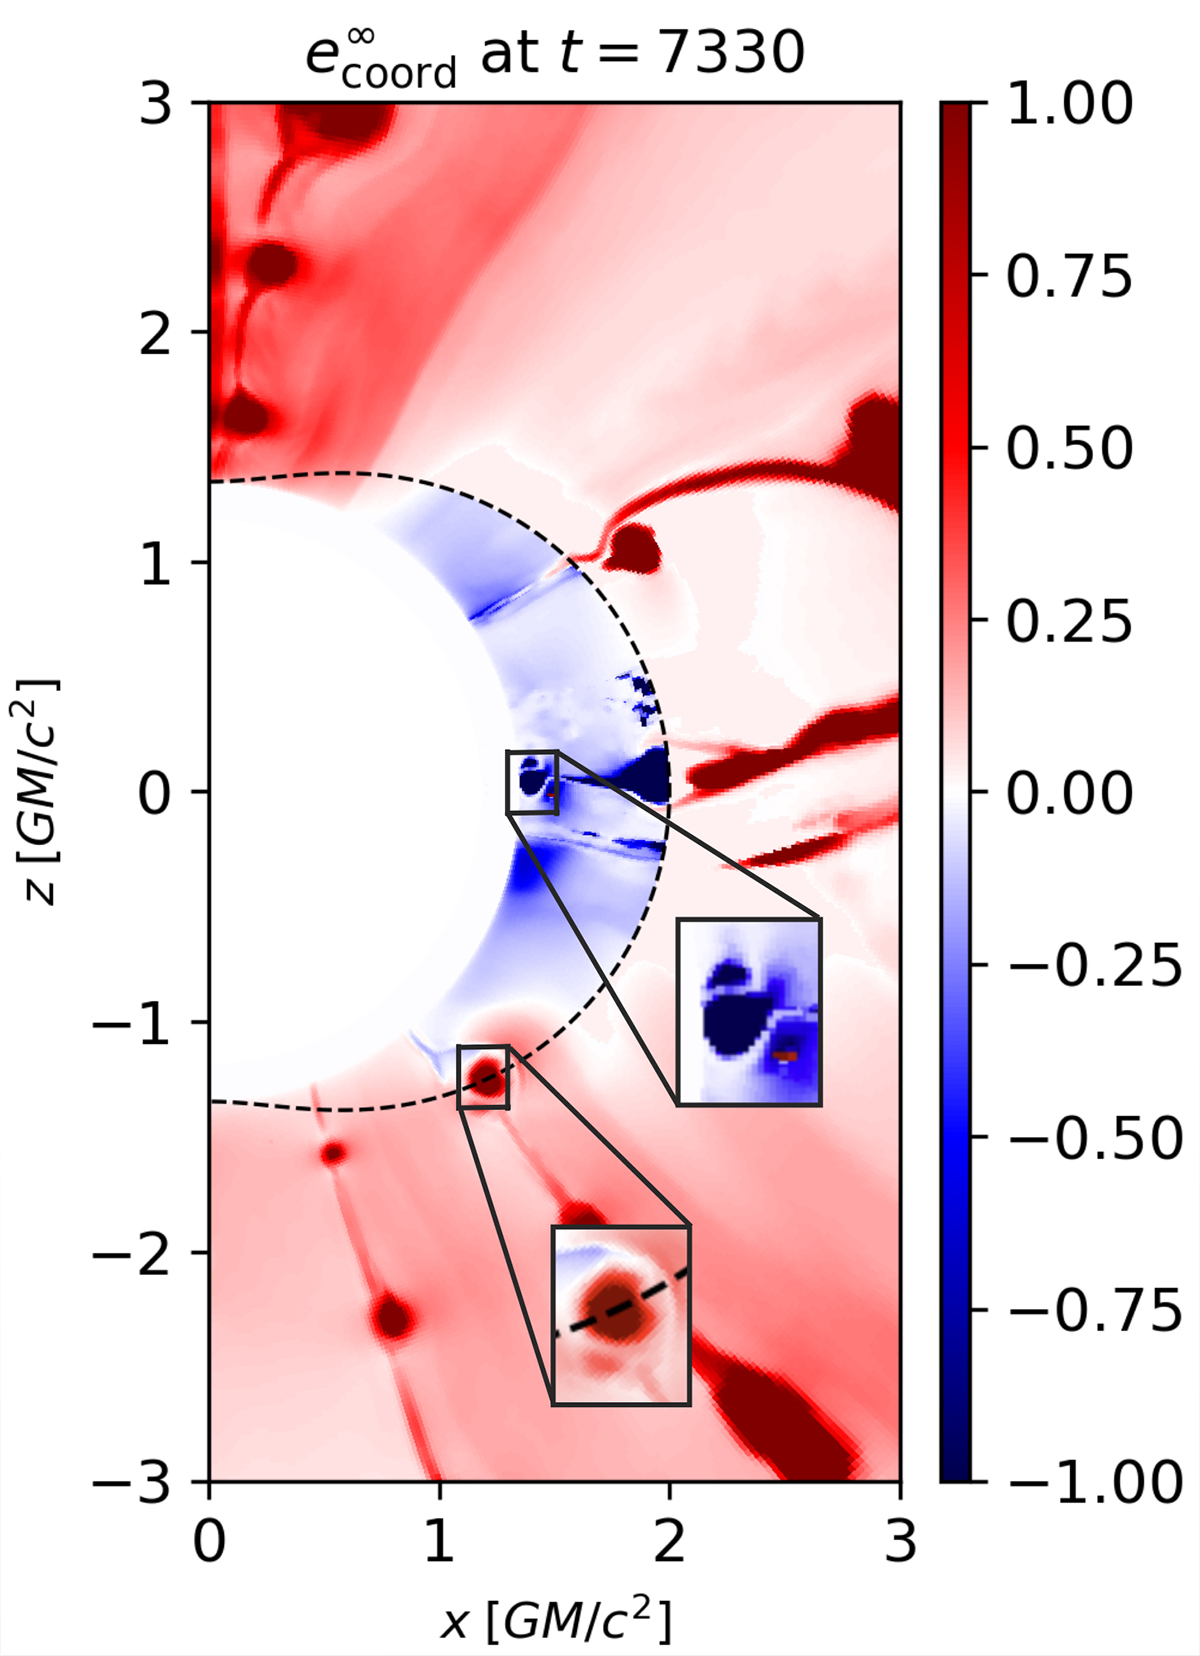
Fig. 14.
Download original image
Distribution of the normalized energy-at-infinity density (e∞) for model A within 3 rg at t = 7330 M. The dashed line indicates the position of ergosphere. The zoomed-in region shows two plasmoids: one associated with negative energy falling into the BH, and the other with positive energy escaping outward.
Current usage metrics show cumulative count of Article Views (full-text article views including HTML views, PDF and ePub downloads, according to the available data) and Abstracts Views on Vision4Press platform.
Data correspond to usage on the plateform after 2015. The current usage metrics is available 48-96 hours after online publication and is updated daily on week days.
Initial download of the metrics may take a while.