Fig. C.1
Download original image
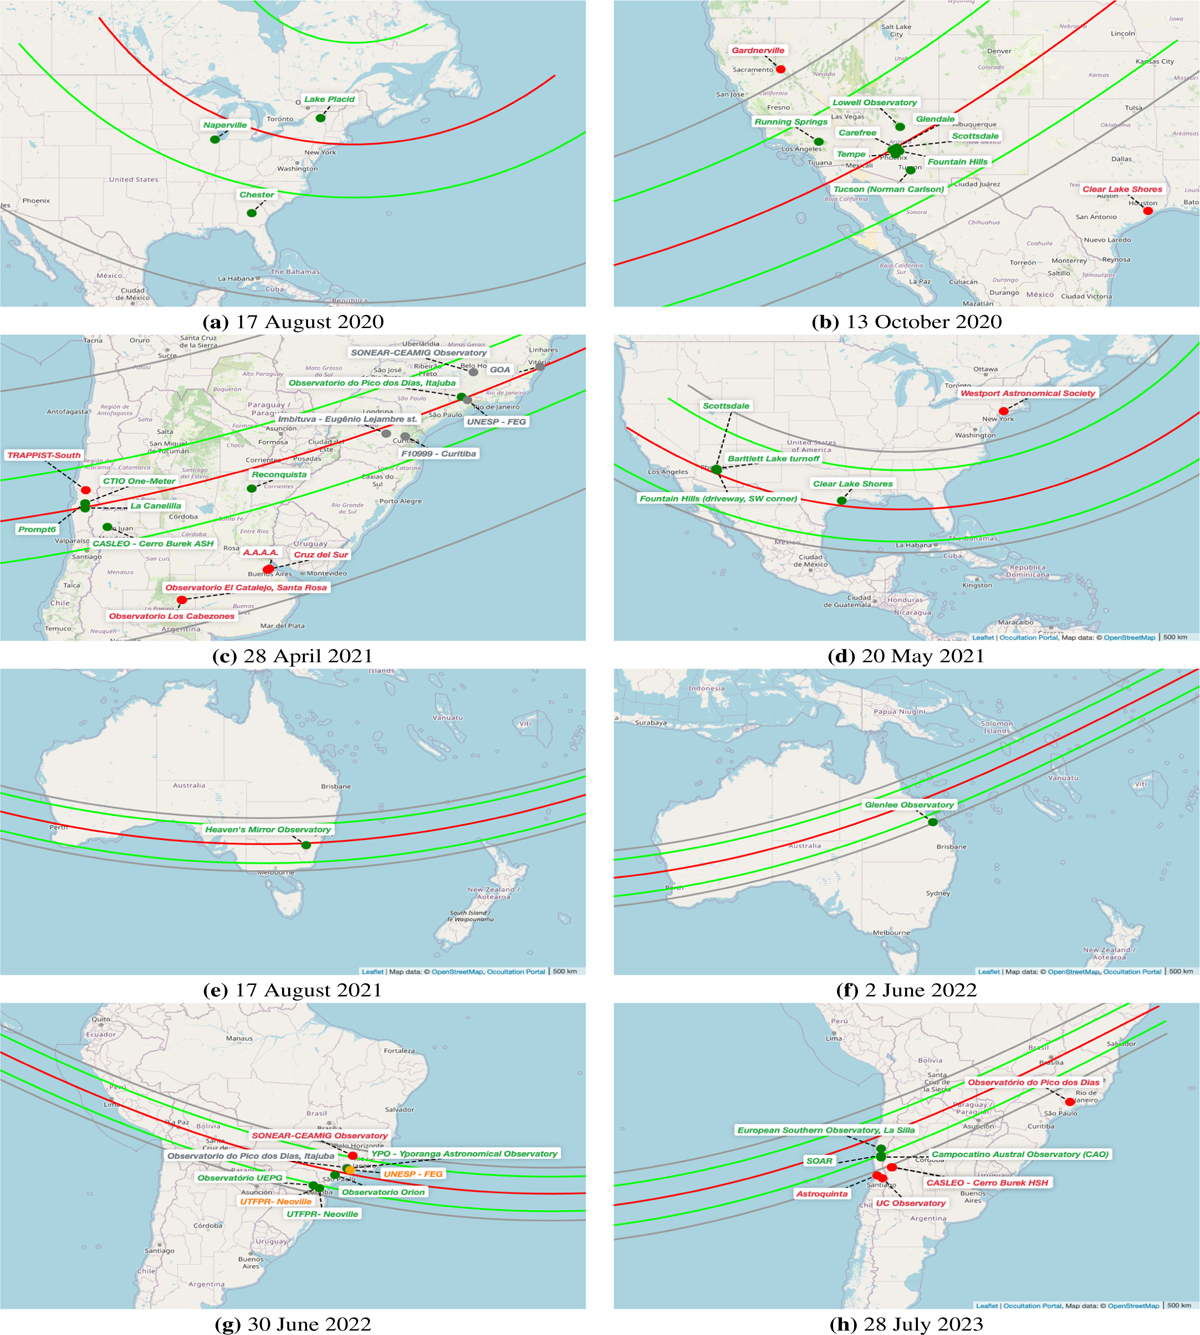
Occultation paths for (28978) Ixion events. Each panel corresponds to a specific observation date. Green circles indicate positive detections, red circles negative detections, grey circles overcast conditions, and orange circles technical failures. The green lines show the maximum and minimum shadow diameter limits of Ixion’s NIMA prediction, the red line the prediction centre, and the grey band the 1σ uncertainty. Data were compiled via the Occultation Portal.
Current usage metrics show cumulative count of Article Views (full-text article views including HTML views, PDF and ePub downloads, according to the available data) and Abstracts Views on Vision4Press platform.
Data correspond to usage on the plateform after 2015. The current usage metrics is available 48-96 hours after online publication and is updated daily on week days.
Initial download of the metrics may take a while.