| Issue |
A&A
Volume 707, March 2026
|
|
|---|---|---|
| Article Number | A70 | |
| Number of page(s) | 22 | |
| Section | Planets, planetary systems, and small bodies | |
| DOI | https://doi.org/10.1051/0004-6361/202557970 | |
| Published online | 09 March 2026 | |
Constraining the size, shape, and albedo of the large trans-Neptunian object (28978) Ixion with multi-chord stellar occultations
1
Instituto de Astrofísica de Andalucía, IAA-CSIC, Glorieta de la Astronomía s/n,
18008
Granada,
Spain
2
LIRA, CNRS UMR8254, Observatoire de Paris,
Meudon,
France
3
Federal University of Technology – Paraná (PPGFA/UTFPR),
Curitiba,
PR,
Brazil
4
Laboratório Interinstitucional de e-Astronomia (LIneA),
Rio de Janeiro,
RJ,
Brazil
5
Observatório Nacional (MCTI),
Rio de Janeiro,
RJ,
Brazil
6
LTE, Observatoire de Paris, Université PSL, Sorbonne Université, Université de Lille, LNE, CNRS,
Paris,
France
7
Türkiye National Observatories, TUG,
Antalya,
Türkiye
8
The Scientific and Technological Research Council of Türkiye (TÜBİTAK),
Ankara,
Türkiye
9
naXys, Department of Mathematics, University of Namur,
Namur,
Belgium
10
Federal University of Rio de Janeiro – Observatory of Valongo,
Rio de Janeiro,
Brazil
11
Instituto de Física, Universidade Federal de Uberlândia,
Uberlândia,
MG,
Brazil
12
UNESP – São Paulo State University, Grupo de Dinâmica Orbital e Planetologia,
Guaratinguetá,
SP,
Brazil
13
Institut Polytechnique des Sciences Avancées (IPSA),
Ivry-sur-Seine,
France
14
Deutsches Zentrum für Astrophysik (DZA),
Görlitz,
Germany
15
Florida Space Institute, University of Central Florida,
Orlando,
FL,
USA
16
Department of Space Sciences and Technologies, Akdeniz University,
Antalya,
Türkiye
17
Trans-Tasman Occultation Alliance (TTOA),
Wellington,
New Zealand
18
Institute of Astronomy and Astrophysics, University of Tübingen,
Germany
19
PADC/DIO, Observatoire de Paris, PSL University,
France
20
Observatoire des Engarouines, Malemort-du-Comtat,
France
21
International Occultation Timing Association (IOTA),
Fountain Hills,
AZ,
USA
22
Institute for Astronomy, University of Edinburgh,
Edinburgh,
UK
23
Société Astronomique de France (SAF),
Paris,
France
24
Grupo Alfa Crucis,
Brazil
25
Lowell Observatory,
Flagstaff,
AZ,
USA
26
Alma Mater Studiorum – University of Bologna, Department of Physics and Astronomy “A. Righi”,
Bologna,
Italy
27
KinetX, Inc., Space Navigation and Flight Dynamics Practice,
Simi Valley,
CA,
USA
28
Universidade Estadual de Ponta Grossa (UEPG),
Ponta Grossa,
Brazil
29
Sapienza Università di Roma,
Rome,
Italy
30
Campo Catino Astronomical Observatory,
Guarcino,
Italy
31
INFN, Sezione Roma1,
Rome,
Italy
32
INAF OAC, Via della Scienza,
Selargius,
Italy
33
Kenyon Astrophysical Observatory (KAO),
Northern California,
USA
34
Skynet Robotic Telescope Network, University of North Carolina,
Chapel Hill,
NC,
USA
35
Johnson Space Center Astronomical Society,
Houston,
TX,
USA
36
Independent observer,
Santana de Parnaíba,
SP,
Brazil
37
Independent observer,
77630
Arbonne-la-Forêt,
France
38
Department of Physics and Astronomy, Appalachian State University,
Boone,
NC,
USA
39
Centro de Amigos de la Astronomia Reconquista – CAAR,
Reconquista,
Argentina
40
Rand Observatory II – MPC W71,
Lake Placid,
NY,
USA
41
Pontificia Universidad Católica de Chile, Center for Astro Engineering,
Santiago,
Chile
42
Asociación Argentina Amigos de la Astronomía,
Argentina
43
Cruz del Sur Private Observatory, El Peral, San Juan Province,
Argentina
44
Westport Astronomical Society, Westport,
Connecticut,
USA
45
University of New Haven,
West Haven,
CT,
USA
46
SONEAR Observatory – CEAMIG, Caeté,
Minas Gerais,
Brazil
47
Centro de Estudos Astronômicos de Minas Gerais (CEAMIG),
Belo Horizonte,
Brazil
48
Space sciences, Technologies & Astrophysics Research (STAR) Institute, University of Liège,
Liège,
Belgium
49
Université Côte d’Azur, Observatoire de la Côte d’Azur, CNRS, Laboratoire Lagrange,
Nice,
France
50
Complejo Astronómico El Leoncito (CASLEO),
San Juan,
Argentina
51
Facultad de Ciencias Astronómicas y Geofísicas (UNLP),
La Plata,
Argentina
52
Instituto de Astronomía y Física del Espacio, CONICET–Universidad de Buenos Aires,
Argentina
53
Agrupaciones Astronómicas de Madrid (AAM) y Teruel (ACTUEL),
Spain
54
El Catalejo Observatory (MPC I48), Santa Rosa,
La Pampa,
Argentina
55
Los Cabezones Observatory (MPC X12), Santa Rosa,
La Pampa,
Argentina
56
Federal University of Espírito Santo: Vitória,
Espírito Santo,
Brazil
★ Corresponding author: This email address is being protected from spambots. You need JavaScript enabled to view it.
Received:
4
November
2025
Accepted:
12
January
2026
Abstract
Context. Trans-Neptunian objects (TNOs) are among the most primitive remnants of the early Solar System. Determining their sizes, shapes, albedos, and surface properties is essential for understanding their origin and evolution. Stellar occultations provide highly accurate size and shape information for TNOs, while photometry constrains their albedo and surface colours. (28978) Ixion is one of the largest TNOs and a prominent Plutino, making it a key target for comparative studies.
Aims. The aim of this work is to constrain Ixion’s projected size, shape, absolute magnitude, geometric albedo, and surface colours, and to search for evidence of an atmosphere or circum-object material.
Methods. We conducted a series of campaigns targeting stellar occultations by Ixion between 2020 and 2023 as part of the Lucky Star collaboration, gathering 51 observations from eight events, including 30 positive detections. Five multi-chord events were used for a global limb fit, enabling an accurate reconstruction of Ixion’s projected shape. Calibrated photometric data, including new and archival measurements, were analysed to derive its absolute magnitude, phase-curve parameters, and broadband colours.
Results. The multi-chord occultations reveal a slightly elongated limb that is well represented by a single projected ellipse with semi-axes a = 363.42−3.85+3.53 km and b = 333.98−4.96+7.07 km, yielding Requiv = 348.39−4.43+5.37 km (Dequiv = 696.78−8.87+10.75 km), and an apparent oblateness ε′ = 0.081−0.010+0.004. The geometry is consistent with a moderately flattened, nearly spheroidal body that may show slight departures from axial symmetry. The typical radial residuals (~10 km) support a largely stable shape across the observed epochs, with modest epoch-dependent variations. The phase-curve fit gives HV = 3.845 ± 0.006, β = 0.1301 ± 0.0078 mag deg−1, and pV = 0.106−0.003+0.003. Multi-band photometry yields B − V = 1.06 ± 0.03, V − R = 0.61 ± 0.02, and R − I = 0.54 ± 0.03, which is consistent with moderately red TNO surfaces. No atmosphere or circum-object material was detected down to our sensitivity limits. The best-sampled event (13 October 2020) also allowed us to measure the angular diameter of the occulted star Gaia DR3 4056440205544338944, θ⋆ = 0.670 ± 0.010 mas, which corresponds to R⋆ = 128 ± 10 R⊙ at the Gaia distance.
Key words: methods: data analysis / methods: observational / astrometry / occultations / planets and satellites: general / Kuiper belt objects: individual: (28978) Ixion
Deceased.
© The Authors 2026
 Open Access article, published by EDP Sciences, under the terms of the Creative Commons Attribution License (https://creativecommons.org/licenses/by/4.0), which permits unrestricted use, distribution, and reproduction in any medium, provided the original work is properly cited.
This article is published in open access under the Subscribe to Open model. This email address is being protected from spambots. You need JavaScript enabled to view it. to support open access publication.
1 Introduction
The stellar occultation technique is one of the most precise Earth-based methods for determining the physical properties of trans-Neptunian objects (TNOs). Since the first successful observation of a stellar occultation by a TNO other than Pluto or Charon, in 2009 (Elliot et al. 2010), this technique has provided highly accurate size measurements with kilometre-level precision and constraints on atmospheric properties down to nanobar levels (e.g. Sicardy et al. 2024; Braga-Ribas et al. 2013), and has enabled the discovery and characterisation of ring systems around objects such as Chariklo, Chiron, Haumea, and Quaoar (Braga-Ribas et al. 2014; Ortiz et al. 2015, 2017; Sickafoose et al. 2020; Ortiz et al. 2023; Morgado et al. 2023; Pereira et al. 2023, 2025; Santos-Sanz et al. 2025). Additionally, stellar occultations have revealed topographic features on TNO surfaces, offering insights into surface irregularities and compositions (Dias-Oliveira et al. 2017; Rommel et al. 2023). Observations of moons, such as Vanth (Orcus/1) and Weywot (Quaoar/1) (Sickafoose et al. 2019; Braga-Ribas et al. 2025), further emphasise the technique’s power in the study of outer Solar System objects. Further occultation studies have also constrained the sizes of smaller TNO satellites, such as Hi’iaka (Fernández-Valenzuela et al. 2025), Namaka (Rommel et al. 2025b), Huya’s moon (Rommel et al. 2025a), 2014WC510 (Leiva et al. 2020), and 2000YW134 (Vara-Lubiano et al. 2023), as well as the shapes of Centaurs, such as 2002 GZ32 (Santos-Sanz et al. 2020), Chiron (Braga-Ribas et al. 2023), Echeclus (Pereira et al. 2024), and Bienor (Rizos et al. 2024), with the shape and spatial orientation of the Centaur Chariklo being a notable example (Leiva et al. 2017; Morgado et al. 2021).
Trans-Neptunian objects are icy remnants from the early Solar System beyond Neptune. Their study provides valuable insights into the primordial conditions of Solar System formation and evolution (Lykawka & Mukai 2008; Morbidelli et al. 2008). Among them is (28978) Ixion, a large Plutino orbiting the Sun in a 3:2 resonance with Neptune. With an estimated diameter in the ~700 km range (see Table 1) and moderately red surface properties, Ixion ranks among the brightest Plutinos and represents a key target for detailed investigation.
To date, around 259 stellar occultations involving 57 TNOs and 14 Centaurs have been observed, but only 41 have yielded multi-chord observations1. Multi-chord data are essential for accurately determining the shapes, sizes, and densities of these distant bodies. Among these, Ixion stands out due to its unique orbital configuration and physical properties. Ixion was discovered in May 2001 at the Cerro Tololo Inter-American Observatory during the Deep Ecliptic Survey (Minor Planet Center 2002). As part of the group of Plutinos in a 3:2 mean-motion resonance with Neptune, Ixion is a relevant target for studying Neptune’s migration history and its influence on the dynamical evolution of the Kuiper Belt. Such resonance-locked configurations are understood in the framework of the resonance capture mechanism proposed by Malhotra (1995).
Ixion’s orbital parameters closely resemble those of Pluto, with a semi-major axis a = 39.35 au, an eccentricity e = 0.244, and an inclination i = 19.67°2. However, Ixion’s slightly higher inclination and distinct surface characteristics make it an intriguing object of study.
The latest equivalent diameter, reported as 709.6 ± 0.2 km from a nearly single-chord stellar occultation (Levine et al. 2021), was derived under the assumption of a circular limb. As acknowledged in that study, the very small formal uncertainty naturally follows from this modelling choice, given that the event geometry provides only limited information on the limb shape. The multi-chord events analysed here therefore complement that result by providing direct constraints on the limb geometry.
Understanding Ixion’s physical structure and potential for hydrostatic equilibrium provides critical insights into the processes governing the evolution of such objects (Grundy et al. 2019). The absolute magnitude (HV) of Ixion has been measured as 3.774 ± 0.021 mag (Alvarez-Candal et al. 2016), and its geometric albedo (pV) is calculated to be 0.108 ± 0.002 (Verbiscer et al. 2022). Photometric measurements indicate a B–V colour index of 1.03 ± 0.03 mag and a V–R colour index of 0.61 ± 0.03 mag, suggesting a moderately red surface (Doressoundiram et al. 2007).
Ixion’s rotation period has not been conclusively determined, and studies on this subject have provided varying results. The first attempt to measure Ixion’s rotation period was conducted by Ortiz et al. (2003), but no periodicity was identified in the light curve, which had an amplitude of <0.15 mag. A subsequent study by Sheppard & Jewitt (2003) also failed to detect any significant variability, setting an upper limit of 0.05 mag for the light curve amplitude. This value is notably lower than the amplitude reported by Ortiz et al. (2003), highlighting its importance. The first successful determination of Ixion’s rotation period was achieved in 2010 using the 3.58 m New Technology Telescope (NTT) at the European Southern Observatory (ESO). Rousselot & Petit (2010) derived a period of 15.9 ± 0.5 h assuming a single-peaked light curve with an amplitude of 0.06 ± 0.03 mag. Based on more recent observations by Galiazzo et al. (2016) at the Las Campanas Observatory, using the 1 m Swope Telescope, Ixion’s rotation period was estimated to be 12.4 ± 0.3 h. This determination is one of several published period estimates, and – like the others – should be regarded as a plausible solution rather than a definitive constraint on Ixion’s rotation state. However, Ixion moves in a crowded stellar field near the Galactic plane, and its photometric measurements are frequently affected by contamination from faint background stars, making the determination of a precise rotational period particularly challenging.
Ixion’s surface composition has also been investigated using near-infrared spectroscopy, which suggests a mix of dark organic materials, amorphous carbon, and possibly traces of water ice and silicates (Boehnhardt et al. 2004; Barkume et al. 2008). Although no satellite has been observed around Ixion, its surface properties are similar to those of Quaoar (which has a satellite called Weywot), another large TNO known for its water ice and tholins.
This article is organised as follows. Section 2 explains our strategy for predicting the stellar occultations analysed in this work. Section 3 describes the observations obtained from different sites and instruments, and presents the resulting positive chords. Section 4 details the analysis of the light curves, which led to constraints on the stellar radius of one of the occulted stars as well as Ixion’s size, shape, and physical parameters (absolute magnitude, phase curve, albedo, and colours). Finally, Sect. 5 discusses the implications of our results and summarises the main conclusions.
Equivalent diameters of (28978) Ixion from various studies.
2 Predictions
The remarkable astrometric precision achieved by the Gaia data releases (Gaia Collaboration 2016a,b, 2018, 2023) has markedly improved the reliability of occultation predictions by providing stellar coordinates at the sub-milliarcsecond level (Rommel et al. 2020). Under these conditions, the dominant source of uncertainty arises from the TNO’s ephemeris.
To address this, we generated updated orbital solutions for Ixion employing the NIMA algorithm (Desmars et al. 2015)3, progressively incorporating new astrometric observations and successive Gaia catalogues (DR2, EDR3, and DR3) across multiple epochs. The iterative refinement of the orbit, culminating in the NIMAv12 solution, enabled predictions with temporal and spatial accuracy sufficient to design and execute observation campaigns with a high probability of success. In addition, astrometric offsets obtained close to the occultation dates (e.g. from the Observatorio de Sierra Nevada, the Calar Alto Observatory, and the Liverpool Telescope) were incorporated to further improve the predictions.
The predicted mid-times and reference star information for each event are summarised in Table 2, including the numerical integration of the motion of an asteroid (NIMA) solution applied in each case. The observed occultation chords derived from these predictions are displayed in Fig. C.1, allowing a direct comparison between the predicted shadow paths and the actual detections.
J2000 star coordinates, proper motions, parallaxes, magnitudes, and NIMA solutions used for each prediction.
3 Observations
Stellar occultation campaigns for (28978) Ixion were conducted between 2020 and 2023 as part of the Lucky Star collaboration4. These campaigns resulted in varying numbers of positive detections, ranging from one to eight chords per event, contributing to a comprehensive multi-chord analysis of Ixion. Observational data, including site status and event details, were collected and managed using the Occultation Portal5, as described in Kilic et al. (2022). A summary of these campaigns, including the number of chords, detection outcomes, and the main geometric and observational parameters of each occultation (geocentric distance, apparent sky-plane velocity, stellar angular diameter, and characteristic spatial sampling), is presented in Table 3.
Across all campaigns, most observers conducted their measurements in ‘clear’ mode (no optical filter) to maximise the signal-to-noise ratio. Weather conditions were generally favourable at the majority of sites, yielding high-quality light curves throughout the 2020–2023 observing period. Detailed information for each event – including observing configurations (telescope aperture, camera type, cadence), filter usage, exposure times, and site-specific weather reports – is provided in Table D.1.
3.1 17 August 2020 occultation
On 17 August 2020, the occultation of the star Gaia DR3 4056438835548480896 (G = 14.52; see Table 2) was recorded from three stations in the United States (Chester, Naperville, and Lake Placid). The predicted mid-time was 01:42:15 UT, the corresponding shadow path is shown in Fig. C.1a, and the event parameters are summarised in Table 3.
Each site reported a positive detection of the occultation. Video and imaging systems with precise timing capabilities were utilised to determine ingress and egress times accurately. The Chester station utilised a WAT-910HX video camera synchronised via Network Time Protocol (NTP), while Naperville and Lake Placid operated QHY174-GPS cameras, providing direct GPS timestamps. Exposure times ranged between 0.3 s and 5 s, depending on the system configuration and observing conditions. All observers used a luminance (L) filter during the acquisition. Image sequences were initiated approximately 5 minutes before the predicted event time and continued for at least 5 minutes afterwards. As seen at Lake Placid (Fig. E.0a), the disappearance was visually noticed just before the recording was initiated. Observers also reported meteorological and seeing conditions to support the assessment of the light-curve quality (see Table D.1).
3.2 13 October 2020 occultation
On 13 October 2020, the occultation was recorded from ten sites across the United States (see Table D.1). The target star was Gaia DR3 4056440205544338944 (G = 10.31; see Table 2). The predicted mid-time was 01:57:46 UT, the shadow geometry is shown in Fig. C.1b, and the corresponding event parameters are summarised in Table 3.
Eight stations reported positive detections, while two sites provided negative chords that contributed essential constraints on the limb geometry. In addition to this extensive campaign, the event was independently observed by Levine et al. (2021) using the 4.3-metre Lowell Discovery Telescope (LDT) near Happy Jack, Arizona, and a 0.32-metre Titan Monitor (TiMo) telescope co-mounted with the Lowell’s Mars Hill 0.8-metre telescope in Flagstaff, Arizona. The present work incorporates a broader set of light curves and a larger number of observing stations, and the data from Levine et al. (2021) were also included to improve consistency across analyses. The overall distribution of the observation network and the predicted shadow track for this event are presented in Fig. C.1b.
Most participating observers employed video cameras synchronised via IOTA-VTI GPS time inserters, achieving subsecond timing accuracy. All stations acquired their data in clear mode, consistent with the standard configuration adopted across the campaigns. Exposure times were typically 0.033 s, providing high temporal resolution well matched to the event geometry.
Given the brightness of the occulted star, its projected angular diameter was also a relevant factor limiting the effective resolution. As Levine et al. (2021) noted, the star is classified as a mid-M giant (a classification consistent with its location in the Hertzsprung–Russell diagram; Kilic 2025a), and its angular diameter was adopted as 0.675 ± 0.010 mas, corresponding to ~19.3 km at Ixion’s distance. This value was used as the initial reference diameter in our analysis and was subsequently cross-checked against our own occultation light curves, as detailed in the analysis section.
Because of the combination of short exposures, Fresnel diffraction, and the unusually large projected stellar diameter for this event, detailed modelling was required to reproduce the ingress and egress shapes. For stations using 0.033 s exposures, the finite integration time, the Fresnel scale, and the size of the stellar disc were explicitly accounted for in the timing fits.
Summary of the geometric and observational parameters for all Ixion stellar occultation events.
3.3 28 April 2021 occultation
This event was remarkable for the wide geographic extent of the observing network, with sixteen stations across Brazil, Argentina, Uruguay, and Chile participating in the campaign (see Table D.1). The occultation involved the G = 14.84 mag star Gaia DR3 4050000576486883840 (see Table 2). The predicted mid-time was 07:35:37 UT, the shadow geometry is shown in Fig. C.1c, and the corresponding event parameters are summarised in Table 3.
Among the participating sites, six successfully detected the event, while five reported negative chords that were essential for constraining the object’s silhouette. The remaining stations were affected by overcast conditions and did not obtain usable data. The observing setups were highly diverse, ranging from the 1.6 m telescope at Observatório do Pico dos Dias (OPD) to smaller 20–30 cm instruments. Exposure times also spanned more than an order of magnitude, from 0.15 s to 10 s, reflecting both instrumental capabilities and observing strategies. Unlike the earlier campaigns, several sites in this observation employed moderate to long exposure times (5–10 s), which significantly smoothed ingress and egress features. However, the inclusion of faster cadence light curves from larger apertures, such as OPD and Cerro Tololo Inter-American Observatory (CTIO), mitigated these limitations and enabled precise chord fitting. Except for the CASLEO–Cerro Burek ASH station, which used a luminance (L) filter, all other observers acquired images in clear mode.
3.4 20 May 2021 occultation
The occultation observed on 20 May 2021 involved five stations in the United States (see Table D.1). The target star was Gaia DR3 4050180170543871104 (G = 14.18; see Table 2). The predicted mid-time was 06:43:23 UT, the shadow geometry is shown in Fig. C.1d, and the corresponding event parameters are summarised in Table 3.
Four stations reported positive detections, while one site provided a negative chord. The telescopes were of moderate aperture (typically 20–40 cm), and exposure times ranged from 0.03 s to 2 s, yielding spatial samplings of order 1–2 km along the chords (sees Tables D.1 and 3). All observers acquired their data in clear mode to maximise signal-to-noise. Because the observing configurations were relatively homogeneous, the set of positive chords provided a coherent astrometric constraint; however, their tight clustering in cross-track position limited the ability to robustly constrain Ixion’s limb shape. In this context, the negative chord from Westport is especially valuable: its proximity to the positive detections sharply restricts the allowed limb extent and significantly improves the silhouette constraint despite the modest network size.
3.5 30 June 2022 occultation
The 30 June 2022 occultation was observed predominantly from Brazil, with eight stations contributing to the campaign (see Table D.1). The target star was Gaia DR3 4049905056379149824 (G = 15.0; see Table 2). The shadow geometry for this event is shown in Fig. C.1g, and the corresponding event parameters are summarised in Table 3.
Five stations obtained usable data, with four recording positive detections of the occultation. The observing configurations were characterised by modest telescope apertures (10–40 cm), but their geographic distribution provided chords sampling different regions of the limb. Although the network size was limited, the resulting chord pattern yielded meaningful astrometric constraints. The negative chord from the Southern Observatory for Near-Earth Asteroids Research (SONEAR) is particularly valuable: its grazing geometry relative to the cluster of positive detections significantly restricts the range of admissible limb solutions and improves the overall silhouette constraint.
Exposure times ranged from 1 to 4.5 s, corresponding to effective spatial samplings of order 1–2 km once combined with diffraction and the projected stellar diameter. All observers used clear mode, consistent with the standard configuration adopted across the campaigns. Weather conditions were favourable at most sites, with only a few stations affected by cloud coverage or technical issues (see Table D.1).
3.6 28 July 2023 occultation
The 28 July 2023 stellar occultation was monitored from seven stations in Chile, Argentina, and Brazil (see Table D.1). The occulted star was Gaia DR3 4049162851669604096 (G = 14.53; see Table 2). The shadow geometry for this event is shown in Fig. C.1h, and the corresponding event parameters are summarised in Table 3.
Of the seven observing sites, three secured clear positive detections of the occultation. Exposure times ranged from 0.1 to 10 s, and weather conditions varied between excellent transparency and localised cloud cover, affecting the success rate across sites. Notably, the positive chords originated from observatories equipped with relatively large apertures – such as the 4.1 m SOAR telescope and the 1.54 m Danish telescope at La Silla, which permit high-cadence photometry with exposures as short as 0.1–0.2 s. All stations except two acquired their data in clear mode; Danish/ESO used a red filter, and Astroquinta employed an L-eNhance filter (see Table D.1). This combination of large telescopes and fast sampling provided precise timings of ingress and egress, enhancing the accuracy of the limb reconstruction. By contrast, several smaller-aperture sites achieved only partial coverage or negative results. Despite the modest number of positive chords, their proximity in the plane of the sky offered useful constraints on Ixion’s profile, albeit limiting the ability to model shape asymmetries comprehensively.
The presence of negative chords, particularly those from the Complejo Astronómico El Leoncito (CASLEO) – Cerro Burek HSH and OPD observatories, proved valuable for bounding the possible limb solutions. These non-detections passed close enough to the positive chords to significantly reduce the uncertainty in Ixion’s size and centre position.
3.7 Single-chord stellar occultations
Two single-chord stellar occultations were successfully recorded in 2021 and 2022, providing useful constraints on Ixion’s size and astrometric position despite their limited geometrical coverage. Both shadow paths crossed southern Australia (see Figs. C.1e and C.1f), enabling observations from wellequipped amateur and professional facilities. The identifiers of the occulted stars are listed in Table 2; event-specific geometric parameters are summarised in Table 3, and the corresponding observing configurations are given in Table D.1.
17 August 2021: the occulted star was Gaia DR3 4056220440657653248 (G = 16.9; see Table 2). The event was recorded from Heaven’s Mirror Observatory (New South Wales) with a 50.8 cm telescope equipped with a QHY174M–GPS camera (Table D.1). A continuous sequence of 3.0 s exposures captured a clear flux drop, yielding a well-defined single chord under stable atmospheric conditions.
2 June 2022: the target star was Gaia DR3 4049248613603980416 (G = 15.3; see Table 2). The event was recorded from Glenlee Observatory (Australia) using a 30 cm telescope equipped with a Watec 910BD camera operating at a 0.32 s cadence. Conditions were cloudless with moderate seeing, and timing was provided by an IOTA-VTI GPS inserter (see Table D.1 for full site details). These observations yielded a nearly grazing chord of 104.3 ± 2.5 km. The grazing geometry significantly reduced the apparent stellar motion relative to the observer, requiring a dedicated determination of the effective limb-crossing speed to accurately derive the ingress and egress times.
Although single-chord events cannot constrain Ixion’s full limb profile, they provide independent astrometric measurements and robust bounds on its size. Continued multi-chord campaigns remain essential to improve constraints on Ixion’s shape and refine its ephemerides.
4 Data analysis and results
The stellar occultation observations analysed here were obtained during international campaigns between 2020 and 2023, involving both professional and amateur observatories equipped with telescopes from small portable instruments to 4-metre-class facilities. Details of the observing sites and acquisition parameters are provided in Appendix D, while Table 6 summarises the archival photometric dataset used to determine Ixion’s absolute magnitude (HV), phase coefficient, and geometric albedo (pV). Data reduction and analysis were carried out using independent pipelines and photometric tools developed within the collaboration.
4.1 Data acquisition and reduction
The observational datasets collected for Ixion span a wide range of formats and image quality, including both flexible image transport system (FITS)6 images and video-based recordings (.avi, .ser, .adv, .aav, etc.). For FITS data accompanied by calibration frames (bias, dark, and flat), a standard pre-reduction routine was applied, which performed bias subtraction, dark correction, and flat-field normalisation using well-established procedures. When video files were provided, they were first converted to FITS format through a dedicated module in the Occultation Portal built upon PyMovie using stacker.py. The details of this conversion pipeline are extensively described in Kilic et al. (2022) and Anderson (2019).
All resulting light curves were generated directly within the Occultation Portal. To ensure the reliability of these results, all datasets were independently analysed with the PRAIA7 (Package for the Reduction of Astronomical Images Automatically) software (Assafin 2023), providing a cross-check with the portal-generated light curves. No significant discrepancies were found.
4.2 Light-curve modelling
All positive light curves were modelled using the SORA8 (Stellar Occultation Reduction Analysis) package (Gomes-Júnior et al. 2022). For each station, the model includes Fresnel diffraction, the finite angular size of the occulted star, the integration time of the detector, and the effective CCD bandwidth. Ingress and egress times were obtained by fitting the SORA model to each light curve, and the resulting timings with their associated 1σ uncertainties are listed in Table A.1, making use of the stellar parameters and event geometries presented in Tables 2 and 3.
Across all events, Fresnel diffraction and the projected stellar diameter are both in the 1.3–1.6 km range, comparable to one another and to the finest spatial sampling achieved in the data. The Fresnel scale is computed as ![Mathematical equation: $\[F=\sqrt{\lambda \Delta / 2}\]$](/articles/aa/full_html/2026/03/aa57970-25/aa57970-25-eq10.png) for λ = 600 nm, yielding F ≃ 1.3–1.4 km over the geocentric distance interval Δ ≃ 37.8–39.3 au. Typical exposure times of 0.1–0.4 s correspond to along-chord resolutions of ~2.5–4.5 km for Ixion’s sky-plane velocities (v ≃ 10–25 km s−1), while the fastest observations (0.033 s cadence) reach ≲1 km sampling, allowing diffraction and finite-star effects to be directly resolved.
for λ = 600 nm, yielding F ≃ 1.3–1.4 km over the geocentric distance interval Δ ≃ 37.8–39.3 au. Typical exposure times of 0.1–0.4 s correspond to along-chord resolutions of ~2.5–4.5 km for Ixion’s sky-plane velocities (v ≃ 10–25 km s−1), while the fastest observations (0.033 s cadence) reach ≲1 km sampling, allowing diffraction and finite-star effects to be directly resolved.
Except for the 17 August 2021 event, all occulted stars lie in the giant regime of the Hertzsprung–Russell diagram (see Kilic 2025a). Their angular diameters were therefore derived using the giant-star calibration of the van Belle (1999) surface-brightness relations, ensuring a uniform and internally consistent treatment across campaigns. The 17 August 2021 star lies on the main sequence and was modelled using the corresponding van Belle coefficients. In all cases, the resulting angular diameters were converted into projected sizes at Ixion’s geocentric distance and used as fixed inputs in the SORA light-curve fits.
Refined stellar diameter estimates from the 13 October 2020 event
As described in Sect. 3.2, the 13 October 2020 event involved Ixion occulting a relatively bright star (G = 10.31 mag), Gaia DR3 4056440205544338944. Because of the star’s brightness and Ixion’s geocentric distance (39.26 au), the projected stellar diameter (hereafter simply ‘stellar diameter’) was a key factor to account for during the modelling process. The Occultation Portal data were obtained using various instruments, primarily small-aperture telescopes, resulting in light curves with different S/N levels. Consequently, the stellar diameter derived from each chord showed minor variations but remained consistent within the uncertainties.
To determine the stellar diameter for each chord, we applied a χ2 minimisation approach (Gomes-Júnior et al. 2022):
![Mathematical equation: $\[\chi^2=\sum_{i=1}^N\left(\frac{\left(\phi_{i, o b s}-\phi_{i, c a l}\right)^2}{\sigma_i^2}\right) .\]$](/articles/aa/full_html/2026/03/aa57970-25/aa57970-25-eq11.png) (1)
(1)
The parameter scan was performed over the range 9.00 km ≤ d⋆ ≤ 30.00 km with a step size of Δd⋆ = 0.25 km, and the values satisfying ![Mathematical equation: $\[\chi^{2}<\chi_{\text {min}}^{2}+\Delta \chi^{2}\]$](/articles/aa/full_html/2026/03/aa57970-25/aa57970-25-eq12.png) at the 3σ confidence level were selected.
at the 3σ confidence level were selected.
From the set of stellar diameters di obtained for each chord (each with its associated uncertainty σi), we derived the weighted mean stellar diameter using
![Mathematical equation: $\[d_{\star}=\frac{\sum_{i=1}^n \frac{d_i}{\sigma_i^2}}{\sum_{i=1}^n \frac{1}{\sigma_i^2}},\]$](/articles/aa/full_html/2026/03/aa57970-25/aa57970-25-eq13.png) (2)
(2)
where n is the total number of chords. The corresponding uncertainty of the weighted mean was calculated as
![Mathematical equation: $\[\sigma_{\star}=\left(\sum_{i=1}^n \frac{1}{\sigma_i^2}\right)^{-\frac{1}{2}} .\]$](/articles/aa/full_html/2026/03/aa57970-25/aa57970-25-eq14.png) (3)
(3)
As illustrated in Fig. 1, the light curve with the lowest uncertainty was obtained by Levine et al. (2021) using the 4.3 m LDT. The relative flux dispersion in this light curve is <0.1, making it the most precise measurement and thus the largest contributor to the weighted mean. Most other light curves were obtained with small telescopes (20–30 cm apertures) under the Lucky Star campaign (see Table D.1).
The final weighted mean angular diameter of the occulted star Gaia DR3 4056440205544338944 is θ⋆ = 0.670 ± 0.010 mas, corresponding to a projected linear diameter of 19.09 ± 0.28 km at Ixion’s distance of 39.26 au. This represents a remarkably precise angular size determination from a TNO occultation and is entirely consistent with the value derived by Levine et al. (2021, 19.25 ± 0.30 km). Combining our result with the star’s Gaia parallax (0.5645 ± 0.0417 mas) yields a physical stellar radius of 128 ± 10 R⊙, also consistent with Levine et al. (2021, ![Mathematical equation: $\[130_{-17}^{+20}\]$](/articles/aa/full_html/2026/03/aa57970-25/aa57970-25-eq15.png) R⊙).
R⊙).
Gaia DR3 provides stellar radii inferred by the GSP-Phot module9 (Creevey et al. 2023), which uses multiple stellar-atmosphere libraries within the Aeneas algorithm (see Andrae et al. 2023). In the main Gaia DR3 catalogue, only a single ‘best’ solution is published for each source. For Gaia DR3 4056440205544338944, this default solution corresponds to the OB-library model, which yields a radius of ~56 R⊙ (which corresponds to an angular diameter of θ⋆ ≃ 0.29 mas), i.e. more than a factor of two smaller than our occultation-based estimate. However, the Gaia DR3 supplementary GSP-Phot results for the same source provide alternative solutions derived from different stellar libraries. In particular, the MARCS-library solution returns a radius of ~116 R⊙ (θ⋆ ≃ 0.61 mas), much closer to the 0.670 ± 0.010 mas angular diameter that we obtain from the occultation. This indicates that the apparent tension arises primarily from the automatic library selection in the GSP-Phot module (Aeneas algorithm) rather than from an intrinsic inconsistency between Gaia and the occultation result. For cool, luminous late-type giants, the module may select as ‘best’ a solution based on a library that is not optimal for this spectral regime, while an alternative library (e.g. MARCS) yields a physically more plausible radius (Sect. 2.6 of Andrae et al. 2023).
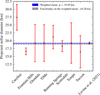 |
Fig. 1 Stellar diameter estimates for the occulted star Gaia DR3 4056440205544338944, obtained by scanning models across the observed light curves of the 13 October 2020 occultation. The weighted mean of all results is μ = 19.09 ± 0.28 km, shown with a 3σ confidence interval. Data from Levine et al. (2021) were also included in the final estimate. The error bars represent the uncertainties derived from model fits to each chord. |
4.3 Limb fitting and astrometry
The ingress and egress times derived from all positive detections (see Table A.1) were projected onto the sky plane to reconstruct the silhouette of (28978) Ixion during each event. These timings were analysed with the SORA package (Gomes-Júnior et al. 2022), using a sharp-edge occultation model that accounts for the finite stellar diameter, Fresnel diffraction, exposure-time smearing, and CCD bandwidth. Negative chords, when available, were incorporated via the filter_negative_chord function to constrain the limb geometry further. When negative chords are present, they naturally restrict the family of acceptable limb solutions, which may clip the outer portions of the 1σ confidence region in Fig. E.2, as occurs for events with constraining non-detections (e.g. 28 April 2021, 20 May 2021, and 30 June 2022).
For the multi-chord events (17 August 2020, 13 October 2020, 28 April 2021, 20 May 2021, 30 June 2022, and 28 July 2023), the observed limb was modelled as an ellipse defined by five free parameters: the centre offsets (f, g) with respect to the NIMA v13 prediction ephemeris, the apparent equatorial radius Requatorial = a, the apparent oblateness ε′ = (a − b)/a, and the position angle of the minor axis, denoted by ϕ and defined as the angle measured eastwards from celestial north. The statistical significance of the fits was evaluated through the reduced chi-square ![Mathematical equation: $\[\chi_{\mathrm{pdf}}^{2}=\chi^{2} /(N-M)\]$](/articles/aa/full_html/2026/03/aa57970-25/aa57970-25-eq16.png) , where N is the number of fitted points and M = 5 the number of free parameters. The 1σ uncertainties for each parameter were obtained by varying the parameter around its nominal value until
, where N is the number of fitted points and M = 5 the number of free parameters. The 1σ uncertainties for each parameter were obtained by varying the parameter around its nominal value until ![Mathematical equation: $\[\chi^{2}=\chi_{\text {min}}^{2}+1\]$](/articles/aa/full_html/2026/03/aa57970-25/aa57970-25-eq17.png) .
.
Given that several events have only a limited number of chords or exhibit significant timing uncertainties, a purely free fit may yield poorly constrained position angles. To mitigate this, we adopted a strategy inspired by Braga-Ribas et al. (2013, 2014), Benedetti-Rossi et al. (2016), Ortiz et al. (2017), Dias-Oliveira et al. (2017), and Rizos et al. (2025), where ϕ is allowed to vary freely but within a physically plausible interval guided by the best-constrained events. In particular, the 13 October 2020, 28 April 2021, and 30 June 2022 occultations, which provide the most reliable constraints, yielded ϕ values of 34.1° ± 15.7°, 35.3° ± 17.5°, and 29.1° ± 11.7°, respectively. These values are mutually consistent, defining a preferred range of approximately 25°–40° for Ixion’s apparent limb orientation. For other events, our fits were guided by this range, ensuring convergence towards physically meaningful solutions without imposing a strict fixed ϕ.
The projection of single chords onto the sky plane yields two symmetrical solutions for the centre position along the direction perpendicular to the chord, leaving the limb shape unconstrained. For this reason, the single-chord events (17 August 2021 and 2 June 2022) are used only to derive the astrometric offsets (f, g), while the limb parameters (a, b, ϕ) are fixed to the global multi-chord solution. Although the 17 August 2021 chord is notably long (~770 km), single-chord geometries do not permit a reliable size estimate, and we therefore do not derive any diameter constraints from these events.
The results of all ellipse fits are summarised in Table 4, which lists the derived (f, g) offsets, equatorial and polar radii, apparent oblateness, ϕ, equivalent radius, radial dispersion, and ![Mathematical equation: $\[\chi_{\mathrm{pdf}}^{2}\]$](/articles/aa/full_html/2026/03/aa57970-25/aa57970-25-eq18.png) . Visual representations of the fitted limbs are shown in Fig. E.2 (panels a–h).
. Visual representations of the fitted limbs are shown in Fig. E.2 (panels a–h).
4.4 Global limb fit
We derived a global limb solution for (28978) Ixion by jointly fitting all multi-chord stellar occultations observed between 2020 and 2023 using a per-event centre minimisation approach. In this framework, Ixion’s apparent limb is described by a single projected ellipse, while the astrometric centre of each occultation event is optimised independently.
The global shape parameters, defined by the semi-axes (a, b) and the position angle (ϕ; measured eastwards from celestial north, modulo 180°), were explored using a Monte Carlo sampling of the 3D (a, b, ϕ) parameter space, centred on physically motivated initial values. For each Monte Carlo realisation, the astrometric centres of all events were re-optimised by minimising the event-wise contributions to the total χ2. The global goodness of fit was then computed as the sum of these event-wise χ2 values.
Allowing independent astrometric centres for each event prevents ephemeris or astrometric offsets from biasing the inferred global limb parameters, ensuring that the shape solution is driven by the relative geometry of the chord extremities rather than by systematic offsets between observing epochs. In addition, a small extra model uncertainty of σmodel = 4 km was added in quadrature to the uncertainties of the chord extremities in the projected f–g plane, in order to account for possible un-modelled limb effects or small-scale topography (Rommel et al. 2023).
The final confidence intervals were derived from the ensemble of accepted Monte Carlo solutions within a Δχ2 threshold of Δχ2 = 3.53, appropriate for three global shape parameters. The total number of free parameters in the fit is therefore M = 3 + 2Nevents, corresponding to the global ellipse parameters and the per-event astrometric centres. The resulting fit involves Ndata = 56 chord extremities and ν = 41 degrees of freedom, yielding a reduced ![Mathematical equation: $\[\chi_{v}^{2}=1.17\]$](/articles/aa/full_html/2026/03/aa57970-25/aa57970-25-eq19.png) , consistent with the expected statistical distribution given the adopted observational and model uncertainties.
, consistent with the expected statistical distribution given the adopted observational and model uncertainties.
The best-fitting global solution is
![Mathematical equation: $\[a=363.42_{-3.85}^{+3.53} \mathrm{~km}, \quad b=333.98_{-4.96}^{+7.07} \mathrm{~km}, \quad \phi=110.97_{-6.54}^{+7.00} ~\mathrm{deg},\]$](/articles/aa/full_html/2026/03/aa57970-25/aa57970-25-eq20.png) (4)
(4)
where the quoted uncertainties correspond to asymmetric 1σ confidence intervals derived from the χ2 surface. From these values, we derived an equivalent radius based on the projected area,
![Mathematical equation: $\[R_{\text {equiv }}=\sqrt{a b}=348.39_{-4.43}^{+5.37} \mathrm{~km},\]$](/articles/aa/full_html/2026/03/aa57970-25/aa57970-25-eq21.png) (5)
(5)
which corresponds to an equivalent diameter
![Mathematical equation: $\[D_{\text {equiv }}=696.78_{-8.87}^{+10.75} \mathrm{~km} .\]$](/articles/aa/full_html/2026/03/aa57970-25/aa57970-25-eq23.png) (6)
(6)
The apparent oblateness is
![Mathematical equation: $\[\epsilon^{\prime}=\frac{a-b}{a}=0.081_{-0.010}^{+0.004},\]$](/articles/aa/full_html/2026/03/aa57970-25/aa57970-25-eq24.png) (7)
(7)
indicating a moderately flattened projected shape.
The resulting global limb solution is illustrated in Fig. 2, where the best-fitting ellipse and its 1σ uncertainty envelope are shown together with the chord extremities from all observing epochs; the corresponding orthogonal residuals are presented in Appendix E.3.
Best-fitted limb solutions for (28978) Ixion (1σ uncertainties) derived from stellar occultations.
4.5 Astrometry
The astrometric solutions for (28978) Ixion derived from eight stellar occultations between 2020 and 2023 are summarised in Table 5. For each event, the ellipse fit provides the centre coordinates (offsets X, Y) relative to the predicted position, defined by the object’s ephemeris and the star coordinates. These offsets were used to determine the precise International Celestial Reference System (ICRS) equatorial coordinates of Ixion at the occultation mid-time (see Table 5).
The sub-milliarcsecond precision achieved in most events is a direct consequence of the accurate timing of the occultation light curves combined with the Gaia DR3 catalogue positions of the occulted stars. These eight astrometric measurements will be incorporated into the orbital refinement of Ixion, improving its ephemeris and the accuracy of future stellar occultation predictions.
4.6 Archival photometry: Hv, G, and pv
We analysed the photometric properties of (28978) Ixion using archival observations. A total of 39 raw V-band images obtained with the New Technology Telescope (NTT) equipped with the ESO Multi-Mode Instrument (EMMI) were retrieved from the ESO archive10, together with two V-band images from the Very Large Telescope (VLT) using the FOcal Reducer and low dispersion Spectrograph 1 (FORS1)11. In addition, 14 unique measurements of Ixion were extracted from the 138 available data of Ixion in the Gaia DR3 database (Gaia Collaboration 2023), and one additional V-band magnitude reported by (Boehnhardt et al. 2004) was included to improve the phase-angle coverage (see Table 6).
From the 39 NTT frames, 28 images were selected based on focus, tracking quality, S/N and minimal contamination from background sources. The ESO data were first processed through standard pre-reduction procedures, and apparent magnitudes were derived using the PhoPS algorithm (Erece et al. 2023). For the Gaia data, the G magnitudes were transformed into V magnitudes using the equations published by Carrasco & Bellazzini (2022). Reduced magnitudes, V(1, α), normalised to r = Δ = 1 AU, were then computed as
![Mathematical equation: $\[V(1, \alpha)=V-5 ~\log (r \Delta),\]$](/articles/aa/full_html/2026/03/aa57970-25/aa57970-25-eq25.png) (8)
(8)
where r and Δ denote the heliocentric and geocentric distances, respectively
Because such distant objects cannot be observed over a wide range of phase angles, we modelled the phase curve in the restricted range 0–2° with a linear relation, V(1, α) = H + β α. The fit yields H = 3.845 ± 0.006 and a slope β = 0.1301 ± 0.0078 mag deg−1 (Fig. 3).
We also retrieved B, R, and I magnitudes from the NTT/EMMI data to derive colour indices for Ixion. To minimise effects related to rotation, phase angle, or distance, we used measurements obtained closest in time. We derived B − V = 1.06 ± 0.03, V − R = 0.61 ± 0.02, and R − I = 0.54 ± 0.03, values consistent with the red spectral slope typically observed among TNOs, and in good agreement with previous results published by Boehnhardt et al. (2004).
Using the equivalent radius derived from the global limb fit (Sect. 4.4), we re-estimated Ixion’s geometric albedo in the visible band.The best-fitting ellipse obtained from the combined multi-chord occultations (2020–2023) yields an equivalent radius of Requiv = ![Mathematical equation: $\[348.39_{-4.43}^{+5.37}\]$](/articles/aa/full_html/2026/03/aa57970-25/aa57970-25-eq26.png) km, corresponding to an equivalent diameter of Dequiv =
km, corresponding to an equivalent diameter of Dequiv = ![Mathematical equation: $\[696.78_{-8.87}^{+10.75}\]$](/articles/aa/full_html/2026/03/aa57970-25/aa57970-25-eq27.png) km. Combining this size with our determination of the absolute magnitude, HV = 3.845 ± 0.006, we derived the geometric albedo pV using the classical relation introduced by Russell (1916), expressed with a modern calibration constant C (e.g. C = 1330 ± 18 km; Masiero et al. 2021):
km. Combining this size with our determination of the absolute magnitude, HV = 3.845 ± 0.006, we derived the geometric albedo pV using the classical relation introduced by Russell (1916), expressed with a modern calibration constant C (e.g. C = 1330 ± 18 km; Masiero et al. 2021):
![Mathematical equation: $\[p_V=\left(\frac{C}{D_{\text {equiv }}}\right)^2 10^{-0.4 H_V} .\]$](/articles/aa/full_html/2026/03/aa57970-25/aa57970-25-eq28.png) (9)
(9)
This calculation yields a visible geometric albedo of pV = ![Mathematical equation: $\[0.106_{-0.003}^{+0.003}\]$](/articles/aa/full_html/2026/03/aa57970-25/aa57970-25-eq29.png) , indicating that Ixion’s surface is slightly darker than previously estimated. The result remains fully consistent within uncertainties with earlier determinations, such as the pV = 0.108 ± 0.002 value reported by Verbiscer et al. (2022), and confirms that Ixion lies among the brighter members of the Plutino population.
, indicating that Ixion’s surface is slightly darker than previously estimated. The result remains fully consistent within uncertainties with earlier determinations, such as the pV = 0.108 ± 0.002 value reported by Verbiscer et al. (2022), and confirms that Ixion lies among the brighter members of the Plutino population.
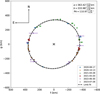 |
Fig. 2 Global limb fit of (28978) Ixion obtained by combining the chord extremities from all multi-chord stellar occultations observed between 2020 and 2023. Each colour and marker shape corresponds to a different event (see the legend). The dashed black curve shows the best-fitting ellipse derived from the global χ2 minimisation, while the grey-shaded region represents the 1σ uncertainty envelope of the global limb solution. Error bars represent the projected uncertainties of the chord extremities in the f–g plane (in kilometres). The black x marks the limb-centred reference frame, and the arrows indicate the celestial north (N) and east (E) directions. The data used in this figure are available in Kilic (2025b). |
Astrometric solutions for (28978) Ixion derived from stellar occultations.
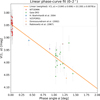 |
Fig. 3 Linear phase-curve fit for Ixion in the restricted 0–2° phase angle range (datasets listed in Table 6). |
5 Discussion and conclusions
Our analysis indicates a moderately elongated body with an area-equivalent diameter of Dequiv = ![Mathematical equation: $\[696.78_{-8.87}^{+10.75}\]$](/articles/aa/full_html/2026/03/aa57970-25/aa57970-25-eq30.png) km and a visible geometric albedo of pV =
km and a visible geometric albedo of pV = ![Mathematical equation: $\[0.106_{-0.003}^{+0.003}\]$](/articles/aa/full_html/2026/03/aa57970-25/aa57970-25-eq31.png) . According to the colour-albedo distribution presented by Lacerda et al. (2014, their Fig. 2), Ixion lies between the dark-neutral and bright red groups, ranking among the brighter members of the Plutino population. The absolute magnitude we derive (HV = 3.845 ± 0.006) is slightly fainter than the value reported by Alvarez-Candal et al. (2016, HV = 3.774 ± 0.021), likely reflecting the broader temporal coverage of our dataset and the consequent mitigation of rotational-phase bias. Although no secure rotational period could be established, the scatter in both the light curves and the residuals of the phase-curve fit suggest slight departures from axial symmetry and/or heterogeneous surface properties, as expected for objects of this size (e.g. Duffard et al. 2009).
. According to the colour-albedo distribution presented by Lacerda et al. (2014, their Fig. 2), Ixion lies between the dark-neutral and bright red groups, ranking among the brighter members of the Plutino population. The absolute magnitude we derive (HV = 3.845 ± 0.006) is slightly fainter than the value reported by Alvarez-Candal et al. (2016, HV = 3.774 ± 0.021), likely reflecting the broader temporal coverage of our dataset and the consequent mitigation of rotational-phase bias. Although no secure rotational period could be established, the scatter in both the light curves and the residuals of the phase-curve fit suggest slight departures from axial symmetry and/or heterogeneous surface properties, as expected for objects of this size (e.g. Duffard et al. 2009).
The global limb fit (Sect. 4.4) shows that the chord extremities from the 2020–2023 occultation campaigns are well reproduced, to first order, by a single projected ellipse. No evidence of systematic trends is found in the residuals, and the reduced ![Mathematical equation: $\[\chi_{\nu}^{2}\]$](/articles/aa/full_html/2026/03/aa57970-25/aa57970-25-eq32.png) close to unity indicates a statistically acceptable fit given the adopted observational and model uncertainties. The derived apparent oblateness, ε′ =
close to unity indicates a statistically acceptable fit given the adopted observational and model uncertainties. The derived apparent oblateness, ε′ = ![Mathematical equation: $\[0.081_{-0.010}^{+0.004}\]$](/articles/aa/full_html/2026/03/aa57970-25/aa57970-25-eq33.png) , is consistent with a moderately flattened projected figure, providing an adequate first-order description of Ixion’s global shape.
, is consistent with a moderately flattened projected figure, providing an adequate first-order description of Ixion’s global shape.
While the majority of occultation epochs are mutually consistent with this global limb solution, the events of 28 April 2021 and 30 June 2022 exhibit noticeable offsets relative to the best-fitting projected ellipse. These deviations are not indicative of shortcomings in the modelling approach but may reflect changes in the projected figure of the body sampled at different rotational phases or aspect angles. In the absence of a well-constrained rotational period, such epoch-dependent variations are naturally expected for a body that departs slightly from axial symmetry, which is consistent with a mildly triaxial figure. The lack of any systematic trend in the residuals for the remaining well-constrained events (Appendix E.3), together with their limited scatter (typically at the ~10 km level), supports the interpretation that a modestly flattened figure provides an adequate global description of Ixion’s shape, while allowing for small departures from perfect axisymmetry.
A unique outcome of this work is the precise measurement of the angular diameter of the occulted star Gaia DR3 4056440205544338944: θ⋆ = 0.670 ± 0.010 mas, which corresponds to a physical stellar radius of 128 ± 10 R⊙. This rare, direct constraint on the size of an M III giant at a distance of ~1.7 kpc is remarkable, as such measurements are typically limited to much closer giants observed with interferometry or lunar occultations (e.g. White & Feierman 1987; Nordgren et al. 1999; Baines et al. 2016, 2018). This result also reveals a significant discrepancy with the Gaia DR3 GSP-Phot ‘best’ estimate obtained from the OB-library model (~56 R⊙, θ ≃ 0.29 mas); the alternative MARCS-library solution (~116 R⊙, θ ≃ 0.61 mas) is in much better agreement with our occultation-based value. This confirms that the apparent mismatch stems primarily from the automatic library selection in the GSP-Phot module rather than from an intrinsic inconsistency between Gaia and the occultation result. Consequently, multi-chord stellar occultations by TNOs can serve not only to constrain the physical properties of the occulting bodies, but also to independently validate Gaia-derived stellar radii in the cool-giant regime.
In addition, our analysis of detection limits (see Appendix B) shows no evidence of rings or other circum-object material around Ixion. The sensitivity of our light curves, particularly the April 2021 event observed from OPD, rules out opaque structures wider than a few hundred metres in the sky plane and constrains tenuous material with optical depths (τ) > 0.1 at kilometre scales. These limits are stringent enough that the dense rings of Chariklo, as well as those observed around Haumea and Quaoar, would have been detected if present. Thus, our results indicate that Ixion lacks ring systems or significant debris within the probed radial ranges, providing an essential negative constraint in the comparative study of small ring-bearing bodies.
Another key outcome of this work was the derivation of precise astrometric positions for Ixion. The eight multi-chord events provided sub-milliarcsecond accuracy, thanks to the combination of accurate timing and Gaia DR3 star catalogues (Table 5). These astrometric constraints offer valuable input for orbit refinement and will enhance the accuracy of future occultation predictions, underscoring the dual contribution of these observations to both physical and dynamical studies of TNOs.
Future progress will rely on improved photometric coverage around opposition, denser occultation campaigns, and complementary thermal radiometry. In particular, determining a reliable rotational period remains a key issue, as our re-analysis of all available datasets revealed no statistically significant periodicity. Such data will allow us to constrain Ixion’s phase curve, spin state, and 3D shape more accurately, and to refine surface property estimates within the context of the broader trans-Neptunian population.
Observational data used in this study.
Acknowledgements
We dedicate this paper to the memory of C.A. Colesanti†, J. Pollock†, and T. George†, whose commitment, passion, and careful work in the field of occultation astronomy remain an inspiration to us all. Their contributions have enriched this study and the broader community, and their legacy will continue to guide future observations. We thank the anonymous referee for their careful review and constructive suggestions, which have helped us to improve the clarity and overall quality of the manuscript. Multiple funding agencies and institutions supported this work. It was partly funded by the Spanish projects PID2020-112789GB-I00 (AEI) and Proyecto de Excelencia de la Junta de Andalucía PY20-01309. This study was financed in part by the Coordenação de Aperfeiçoamento de Pessoal de Nível Superior – Brasil (CAPES) – Finance Code 001. J.L.O., P.S.-S., N.M., A.A.C, R.D., Y.K., J.L.R., and J.M.L.G. acknowledge financial support from the Severo Ochoa grant CEX2021-001131-S (MCIN/AEI/10.13039/501100011033). F.B.-R. acknowledges CNPq (grant 316604/2023-2) and the financial support of the NAPI “Fenômenos Extremos do Universo” of Fundação de Apoio à Ciência, Tecnologia e Inovação do Paraná. P.S.-S. and Y.K. also acknowledge support from the Spanish I+D+i project PID2022-139555NB-I00 (TNO-JWST) funded by MCIN/AEI/10.13039/501100011033. This work has been supported by the French ANR project Roche, number ANR-23-CE49-0012. J.L.R. acknowledges financial support from grant PID2021-126365NB-C21. AAC acknowledges financial support from the project PID2023-153123NB-I00 funded by MCIN/AEI. J.M.G.L. acknowledges funding by the Spanish Ministry of Universities through the university training programme FPU2022/00492. BEM thanks CAPES Grant 23079.212658/2024-30. ARGJ thanks the financial support of FAPEMIG APQ-02987-24. This work is partly based on observations collected at the Centro Astronómico Hispano en Andalucía (CAHA), Observatorio de Sierra Nevada (IAA-CSIC), and the Liverpool Telescope at the Roque de los Muchachos Observatory (IAC). LMC thanks CAPES for the financial support, Finance Code 001, and 88881.981125/2024-01. Based on data acquired at Complejo Astronómico El Leoncito, operated under agreement between the Consejo Nacional de Investigaciones Científicas y Técnicas de la República Argentina and the National Universities of La Plata, Córdoba and San Juan. We also thank T. Linder for his valuable contribution to the 2021 April 28 observation of Ixion, performed with the CTIO 1-meter telescope, which provided important constraints for this study. Based on observations collected at the La Silla European Southern Observatory. TRAPPIST is funded by the Belgian F.R.S.-FNRS under grant PDR T.0120.21. EJ is Director of Research at the Belgian F.R.S.-FNRS. This research has made use of data from the European Space Agency (ESA) mission Gaia (https://www.cosmos.esa.int/gaia), processed by the Gaia Data Processing and Analysis Consortium (https://www.cosmos.esa.int/web/gaia/dpac/consortium), with funding provided by institutions participating in the Gaia Multilateral Agreement. CLP thanks the FAPERJ/DSC-10 E-26/204.141/2022, FAPERJ/PDR-10 E-26/200.107/2025, and FAPERJ 200.108/ 2025. This work was supported by the project Gaia Moons of the Agence Nationale de Recherche (France), grant ANR-22-CE49-0002.
References
- Altenhoff, W. J., Bertoldi, F., & Menten, K. M. 2004, A&A, 415, 771 [NASA ADS] [CrossRef] [EDP Sciences] [Google Scholar]
- Alvarez-Candal, A., Pinilla-Alonso, N., Ortiz, J. L., et al. 2016, A&A, 586, A155 [NASA ADS] [CrossRef] [EDP Sciences] [Google Scholar]
- Anderson, B. 2019, J. Occult. Astron., 9, 9 [Google Scholar]
- Andrae, R., Fouesneau, M., Sordo, R., et al. 2023, A&A, 674, A27 [CrossRef] [EDP Sciences] [Google Scholar]
- Assafin, M. 2023, Planet. Space Sci., 239, 105816 [Google Scholar]
- Baines, E. K., Döllinger, M. P., Guenther, E. W., et al. 2016, AJ, 152, 66 [Google Scholar]
- Baines, E. K., Armstrong, J. T., Schmitt, H. R., et al. 2018, AJ, 155, 30 [Google Scholar]
- Barkume, K. M., Brown, M. E., & Schaller, E. L. 2008, AJ, 135, 55 [NASA ADS] [CrossRef] [Google Scholar]
- Benedetti-Rossi, G., Sicardy, B., Buie, M. W., et al. 2016, AJ, 152, 156 [NASA ADS] [CrossRef] [Google Scholar]
- Bertoldi, B., Altenhoff, W., & Junkes, N. 2002, Beyond Pluto: Max-Planck radioastronomers measure the sizes of distant minor planets, https://astro.uni-bonn.de/~bertoldi/press/kbo/pr_kbo_e.html [Google Scholar]
- Boehnhardt, H., Bagnulo, S., Muinonen, K., et al. 2004, A&A, 415, L21 [NASA ADS] [CrossRef] [EDP Sciences] [Google Scholar]
- Braga-Ribas, F., Sicardy, B., Ortiz, J. L., et al. 2013, ApJ, 773, 26 [NASA ADS] [CrossRef] [Google Scholar]
- Braga-Ribas, F., Sicardy, B., Ortiz, J. L., et al. 2014, Nature, 508, 72 [NASA ADS] [CrossRef] [Google Scholar]
- Braga-Ribas, F., Pereira, C. L., Sicardy, B., et al. 2023, A&A, 676, A72 [NASA ADS] [CrossRef] [EDP Sciences] [Google Scholar]
- Braga-Ribas, F., Vachier, F., Desmars, J., Margoti, G., & Sicardy, B. 2025, Philos. Trans. Roy. Soc. Lond. Ser. A, 383, 20240200 [Google Scholar]
- Brown, M. E. 2008, in The Solar System Beyond Neptune, eds. M. A. Barucci, H. Boehnhardt, D. P. Cruikshank, A. Morbidelli, & R. Dotson (University of Arizona Press), 335 [Google Scholar]
- Carrasco, J. M., & Bellazzini, M. 2022, Gaia DR3 documentation: Photometric relationships with other photometric systems, https://gea.esac.esa.int/archive/documentation/GDR3/Data_processing/chap_cu5pho/cu5pho_sec_photSystem/cu5pho_ssec_photRelations.html#Ch5.T8e, accessed: 23 September 2025 [Google Scholar]
- Creevey, O. L., Sordo, R., Pailler, F., et al. 2023, A&A, 674, A26 [NASA ADS] [CrossRef] [EDP Sciences] [Google Scholar]
- Cruikshank, D. P., Barucci, M. A., Emery, J. P., et al. 2007, in Protostars and Planets V, eds. B. Reipurth, D. Jewitt, & K. Keil, 879 [Google Scholar]
- Desmars, J., Camargo, J. I. B., Braga-Ribas, F., et al. 2015, A&A, 584, A96 [NASA ADS] [CrossRef] [EDP Sciences] [Google Scholar]
- Dias-Oliveira, A., Sicardy, B., Ortiz, J. L., et al. 2017, AJ, 154, 22 [NASA ADS] [CrossRef] [Google Scholar]
- Doressoundiram, A., Peixinho, N., Moullet, A., et al. 2007, AJ, 134, 2186 [NASA ADS] [CrossRef] [Google Scholar]
- Doressoundiram, A., Peixinho, N., de Bergh, C., et al. 2002, AJ, 124, 2279 [NASA ADS] [CrossRef] [Google Scholar]
- Duffard, R., Ortiz, J. L., Thirouin, A., Santos-Sanz, P., & Morales, N. 2009, A&A, 505, 1283 [NASA ADS] [CrossRef] [EDP Sciences] [Google Scholar]
- Elliot, J. L., Person, M. J., Zuluaga, C. A., et al. 2010, Nature, 465, 897 [NASA ADS] [CrossRef] [Google Scholar]
- Erece, O., Khamitov, I. M., Kaplan, M., et al. 2023, Planet. Space Sci., 232, 105698 [Google Scholar]
- Fernández-Valenzuela, E., Ortiz, J. L., Holler, B. J., et al. 2025, Nat. Commun., 16, 10926 [Google Scholar]
- Gaia Collaboration (Brown, A. G. A., et al.) 2016a, A&A, 595, A2 [NASA ADS] [CrossRef] [EDP Sciences] [Google Scholar]
- Gaia Collaboration (Prusti, T., et al.) 2016b, A&A, 595, A1 [NASA ADS] [CrossRef] [EDP Sciences] [Google Scholar]
- Gaia Collaboration (Brown, A. G. A., et al.) 2018, A&A, 616, A1 [NASA ADS] [CrossRef] [EDP Sciences] [Google Scholar]
- Gaia Collaboration (Vallenari, A., et al.) 2023, A&A, 674, A1 [NASA ADS] [CrossRef] [EDP Sciences] [Google Scholar]
- Galiazzo, M., de la Fuente Marcos, C., de la Fuente Marcos, R., et al. 2016, Astrophys. Space Sci., 361, 212 [Google Scholar]
- Gomes-Júnior, A. R., Morgado, B. E., Benedetti-Rossi, G., et al. 2022, MNRAS, 511, 1167 [CrossRef] [Google Scholar]
- Grundy, W., Noll, K., & Stephens, D. 2005, Icarus, 176, 184 [Google Scholar]
- Grundy, W., Noll, K., Buie, M., et al. 2019, Icarus, 334, 30 [CrossRef] [Google Scholar]
- Kilic, Y. 2025a, https://doi.org/10.5281/zenodo.17524000 [Google Scholar]
- Kilic, Y. 2025b, https://doi.org/10.5281/zenodo.17901912 [Google Scholar]
- Kilic, Y., Braga-Ribas, F., Kaplan, M., et al. 2022, MNRAS, 515, 1346 [NASA ADS] [CrossRef] [Google Scholar]
- Lacerda, P., Fornasier, S., Lellouch, E., et al. 2014, ApJ, 793, L2 [NASA ADS] [CrossRef] [Google Scholar]
- Leiva, R., Sicardy, B., Camargo, J. I. B., et al. 2017, AJ, 154, 159 [NASA ADS] [CrossRef] [Google Scholar]
- Leiva, R., Buie, M. W., Keller, J. M., et al. 2020, PSJ, 1, 48 [Google Scholar]
- Lellouch, E., Santos-Sanz, P., Lacerda, P., et al. 2013, A&A, 557, A60 [NASA ADS] [CrossRef] [EDP Sciences] [Google Scholar]
- Levine, S. E., Zuluaga, C. A., Person, M. J., et al. 2021, AJ, 161, 210 [Google Scholar]
- Lykawka, P. S., & Mukai, T. 2008, AJ, 135, 1161 [Google Scholar]
- Malhotra, R. 1995, AJ, 110, 420 [NASA ADS] [CrossRef] [Google Scholar]
- Masiero, J. R., Wright, E. L., & Mainzer, A. K. 2021, PSJ, 2, 32 [NASA ADS] [Google Scholar]
- Minor Planet Center 2002, Minor Planet Circulars (MPC), available at: https://www.minorplanetcenter.net/iau/ECS/MPCArchive/2002/MPC_20020328.pdf [Accessed: January 11, 2025] [Google Scholar]
- Mommert, M. 2013, PhD thesis, Freie Universität Berlin [Google Scholar]
- Morbidelli, A., Levison, H. F., & Gomes, R. 2008, in The Solar System Beyond Neptune, eds. M. A. Barucci, H. Boehnhardt, D. P. Cruikshank, A. Morbidelli, & R. Dotson (arXiv), 275 [Google Scholar]
- Morgado, B. E., Sicardy, B., Braga-Ribas, F., et al. 2021, A&A, 652, A141 [NASA ADS] [CrossRef] [EDP Sciences] [Google Scholar]
- Morgado, B. E., Sicardy, B., Braga-Ribas, F., et al. 2023, Nature, 614, 239 [NASA ADS] [CrossRef] [Google Scholar]
- Nordgren, T. E., Germain, M. E., Benson, J. A., et al. 1999, AJ, 118, 3032 [NASA ADS] [CrossRef] [Google Scholar]
- Ortiz, J. L., Gutiérrez, P. J., Casanova, V., & Sota, A. 2003, A&A, 407, 1149 [NASA ADS] [CrossRef] [EDP Sciences] [Google Scholar]
- Ortiz, J. L., Duffard, R., Pinilla-Alonso, N., et al. 2015, A&A, 576, A18 [NASA ADS] [CrossRef] [EDP Sciences] [Google Scholar]
- Ortiz, J. L., Santos-Sanz, P., Sicardy, B., et al. 2017, Nature, 550, 219 [NASA ADS] [CrossRef] [Google Scholar]
- Ortiz, J. L., Pereira, C. L., Sicardy, B., et al. 2023, A&A, 676, L12 [CrossRef] [EDP Sciences] [Google Scholar]
- Pereira, C. L., Sicardy, B., Morgado, B. E., et al. 2023, A&A, 673, L4 [NASA ADS] [CrossRef] [EDP Sciences] [Google Scholar]
- Pereira, C. L., Braga-Ribas, F., Sicardy, B., et al. 2024, MNRAS, 527, 3624 [Google Scholar]
- Pereira, C. L., Braga-Ribas, F., Sicardy, B., et al. 2025, ApJ, 992, L19 [Google Scholar]
- Rabinowitz, D. L., Schaefer, B. E., & Tourtellotte, S. W. 2007, AJ, 133, 26 [NASA ADS] [CrossRef] [Google Scholar]
- Rizos, Fernández-Valenzuela, E., Ortiz, J. L., et al. 2024, A&A, 689, A82 [NASA ADS] [CrossRef] [EDP Sciences] [Google Scholar]
- Rizos, J. L., Ortiz, J. L., Rommel, F. L., et al. 2025, A&A, 697, A62 [NASA ADS] [CrossRef] [EDP Sciences] [Google Scholar]
- Rommel, F. L., Braga-Ribas, F., Desmars, J., et al. 2020, A&A, 644, A40 [NASA ADS] [CrossRef] [EDP Sciences] [Google Scholar]
- Rommel, F. L., Braga-Ribas, F., Ortiz, J. L., et al. 2023, A&A, 678, A167 [NASA ADS] [CrossRef] [EDP Sciences] [Google Scholar]
- Rommel, F. L., Fernández-Valenzuela, E., Proudfoot, B. C. N., et al. 2025a, PSJ, 6, 48 [Google Scholar]
- Rommel, F. L., Proudfoot, B. C. N., Holler, B. J., Ortiz, J. L., & Fernández-Valenzuela, E. 2025b, RNAAS, 9, 62 [Google Scholar]
- Rousselot, P., & Petit, J. 2010, in AAS/Division for Planetary Sciences Meeting Abstracts, 42, 40.19 [Google Scholar]
- Russell, H. N. 1916, ApJ, 43, 173 [Google Scholar]
- Santos-Sanz, P., Ortiz, J. L., Sicardy, B., et al. 2020, MNRAS, 501, 6062 [Google Scholar]
- Santos-Sanz, P., Gomes-Júnior, A. R., Morgado, B. E., et al. 2025, arXiv e-prints [arXiv:2510.06366] [Google Scholar]
- Sheppard, S. S., & Jewitt, D. C. 2003, Earth Moon Planets, 92, 207 [Google Scholar]
- Sicardy, B., Braga-Ribas, F., Buie, M. W., Ortiz, J. L., & Roques, F. 2024, A&A Rev., 32, 6 [Google Scholar]
- Sickafoose, A. A., Bosh, A. S., Levine, S. E., et al. 2019, Icarus, 319, 657 [NASA ADS] [CrossRef] [Google Scholar]
- Sickafoose, A. A., Bosh, A. S., Emery, J. P., et al. 2020, MNRAS, 491, 3643 [NASA ADS] [CrossRef] [Google Scholar]
- Stansberry, J. A., Cruikshank, D. P., Grundy, W. G., et al. 2005, in AAS/Division for Planetary Sciences Meeting Abstracts, 37, 52.05 [Google Scholar]
- Stansberry, J., Grundy, W., Brown, M., et al. 2008, in The Solar System Beyond Neptune, eds. M. Barucci, H. Boehnhardt, D. Cruikshank, A. Morbidelli, & R. Dotson (University of Arizona Press), 161 [Google Scholar]
- van Belle, G. T. 1999, PASP, 111, 1515 [NASA ADS] [CrossRef] [Google Scholar]
- Vara-Lubiano, M., Fernández-Valenzuela, E., Kretlow, M., et al. 2023, in Planetary Sciences and Exploration of the Solar System (7th CPESS), 80575 [Google Scholar]
- Verbiscer, A. J., Helfenstein, P., Porter, S. B., et al. 2022, PSJ, 3, 95 [NASA ADS] [Google Scholar]
- White, N. M., & Feierman, B. H. 1987, AJ, 94, 751 [Google Scholar]
Based on Braga-Ribas (priv. comm.) and the Occultation Portal database: https://occultationportal.org
JPL Small-Body Database: https://ssd.jpl.nasa.gov/
For Ixion’s ephemerides, see https://lesia.obspm.fr/lucky-star/obj.php?p=1192.
General Stellar Parametrizer from Photometry.
ESO programme ID 075.C-0431(A).
ESO programme ID 178.C-0036(N).
Appendix A Ingress and egress times from light-curve modelling
Ingress and egress times obtained from the light curve modelling of all positive detections.
Appendix B Detection limits on additional material around Ixion
We analysed the light curves from all the events studied in this work to search for additional material around Ixion. Following the procedures outlined in Morgado et al. (2023), Pereira et al. (2023), Braga-Ribas et al. (2023), and Pereira et al. (2024), we determined the upper limits for the apparent equivalent width and optical depth obtained from E′p = [1 − ϕ(i)]Δr(i) and τ = τ′/2 (where ![Mathematical equation: $\[\tau^{\prime}=-\ln \left(1-p_{3 \sigma}^{\prime}\right)\]$](/articles/aa/full_html/2026/03/aa57970-25/aa57970-25-eq34.png) ), respectively. Table B.1 presents the results obtained in each event. The limits were determined using the original spatial resolution δr in the regions external to the occultation by the central body (when a positive detection), covering a certain distance in the sky plane, not necessarily centred on the body’s position. Using as an example the light curve obtained at OPD for the 28 April 2021 event, the 3σ limit for the apparent equivalent width is
), respectively. Table B.1 presents the results obtained in each event. The limits were determined using the original spatial resolution δr in the regions external to the occultation by the central body (when a positive detection), covering a certain distance in the sky plane, not necessarily centred on the body’s position. Using as an example the light curve obtained at OPD for the 28 April 2021 event, the 3σ limit for the apparent equivalent width is ![Mathematical equation: $\[E_{p}^{\prime}=400\]$](/articles/aa/full_html/2026/03/aa57970-25/aa57970-25-eq35.png) metres. This indicates that an opaque structure with a width in the sky plane of W⊥ > 400 meters would cause a flux drop in the light curve above our 3σ cut. On the other hand, a structure with an apparent width W⊥ = 2.1 km (δr) would be detected if its optical depth were τ > 0.1. We can compare the detection limits obtained for Ixion with the physical properties of known rings around other small bodies. In our example using the April 2021 light curve from OPD, Chariklo’s densest ring (C1R) would be detected (Ep~2 km). Additionally, the Q1R ring around Quaoar and Haumea’s ring would also be detected if present around Ixion.
metres. This indicates that an opaque structure with a width in the sky plane of W⊥ > 400 meters would cause a flux drop in the light curve above our 3σ cut. On the other hand, a structure with an apparent width W⊥ = 2.1 km (δr) would be detected if its optical depth were τ > 0.1. We can compare the detection limits obtained for Ixion with the physical properties of known rings around other small bodies. In our example using the April 2021 light curve from OPD, Chariklo’s densest ring (C1R) would be detected (Ep~2 km). Additionally, the Q1R ring around Quaoar and Haumea’s ring would also be detected if present around Ixion.
Detection limits on additional material derived from all light curves.
Appendix C Summary of the occultation campaigns
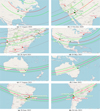 |
Fig. C.1 Occultation paths for (28978) Ixion events. Each panel corresponds to a specific observation date. Green circles indicate positive detections, red circles negative detections, grey circles overcast conditions, and orange circles technical failures. The green lines show the maximum and minimum shadow diameter limits of Ixion’s NIMA prediction, the red line the prediction centre, and the grey band the 1σ uncertainty. Data were compiled via the Occultation Portal. |
Appendix D Observation details
The observing circumstances and notation conventions are described in the table footnotes.
Observation details for the occultations by (28978) Ixion.
Appendix E Light curves, limb fits, and radial residuals
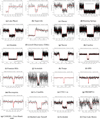 |
Fig. E.0 Normalised flux light curves of the stellar occultations by (28978) Ixion. The black points represent the observed flux with uncertainties, and the red line shows the best-fit model. The x-axis represents the time in seconds relative to 00:00:00 UT on the observation date, and the y-axis shows the normalised flux. Continued. |
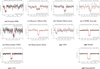 |
Fig. E.1 Continued. |
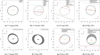 |
Fig. E.2 Limb-fit diagrams for the eight stellar occultations by (28978) Ixion: (a) 17 August 2020, (b) 13 October 2020, (c) 28 April 2021, (d) 20 May 2021, (e) 17 August 2021, (f) 2 June 2022, (g) 30 June 2022, and (h) 28 July 2023. Each chord is shown in a different colour, corresponding to the observing sites listed in the legends. Positive detections define the limb of the body, while continuous full-length chords represent negative observations that constrain the maximum extent of the limb. The x- and y-axes correspond to the sky-plane coordinates f and g (in km), oriented along the fundamental plane of the occultation. For the single-chord events (e and f), the limb shape was fixed to the global solution; only the astrometric offsets (f, g) were determined. The red segments at the ends of the chords represent the ingress and egress timing uncertainties. An elliptical fit was applied in each case, with the best-fit solution (1σ) shown. The grey-shaded regions around the ellipses indicate the 1σ confidence domains obtained from the fitting procedure. The corresponding parameters are listed in Table 4. The black arrow indicates the direction of the shadow motion, while the arrows labelled N and S denote celestial north and south, respectively. |
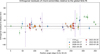 |
Fig. E.3 Orthogonal (normal) residuals of the chord extremities with respect to the global limb solution, plotted as a function of position angle in the ellipse-aligned frame. Residuals are measured along the local normal to the best-fitting ellipse, ensuring a geometrically consistent assessment of deviations over the entire limb. Each colour and marker corresponds to a different occultation epoch (same coding as in Fig. 2). No clear systematic trend with position angle is observed, indicating that the residuals are consistent with random scatter within the adopted observational and model uncertainties. The offsets observed for the 28 April 2021 and 30 June 2022 epochs are discussed in Sect. 5 and may be associated with changes in the projected figure of the body at different rotational phases or aspect angles. |
All Tables
J2000 star coordinates, proper motions, parallaxes, magnitudes, and NIMA solutions used for each prediction.
Summary of the geometric and observational parameters for all Ixion stellar occultation events.
Best-fitted limb solutions for (28978) Ixion (1σ uncertainties) derived from stellar occultations.
Ingress and egress times obtained from the light curve modelling of all positive detections.
All Figures
|
Fig. 1 Stellar diameter estimates for the occulted star Gaia DR3 4056440205544338944, obtained by scanning models across the observed light curves of the 13 October 2020 occultation. The weighted mean of all results is μ = 19.09 ± 0.28 km, shown with a 3σ confidence interval. Data from Levine et al. (2021) were also included in the final estimate. The error bars represent the uncertainties derived from model fits to each chord. |
| In the text | |
|
Fig. 2 Global limb fit of (28978) Ixion obtained by combining the chord extremities from all multi-chord stellar occultations observed between 2020 and 2023. Each colour and marker shape corresponds to a different event (see the legend). The dashed black curve shows the best-fitting ellipse derived from the global χ2 minimisation, while the grey-shaded region represents the 1σ uncertainty envelope of the global limb solution. Error bars represent the projected uncertainties of the chord extremities in the f–g plane (in kilometres). The black x marks the limb-centred reference frame, and the arrows indicate the celestial north (N) and east (E) directions. The data used in this figure are available in Kilic (2025b). |
| In the text | |
|
Fig. 3 Linear phase-curve fit for Ixion in the restricted 0–2° phase angle range (datasets listed in Table 6). |
| In the text | |
|
Fig. C.1 Occultation paths for (28978) Ixion events. Each panel corresponds to a specific observation date. Green circles indicate positive detections, red circles negative detections, grey circles overcast conditions, and orange circles technical failures. The green lines show the maximum and minimum shadow diameter limits of Ixion’s NIMA prediction, the red line the prediction centre, and the grey band the 1σ uncertainty. Data were compiled via the Occultation Portal. |
| In the text | |
|
Fig. E.0 Normalised flux light curves of the stellar occultations by (28978) Ixion. The black points represent the observed flux with uncertainties, and the red line shows the best-fit model. The x-axis represents the time in seconds relative to 00:00:00 UT on the observation date, and the y-axis shows the normalised flux. Continued. |
| In the text | |
|
Fig. E.1 Continued. |
| In the text | |
|
Fig. E.2 Limb-fit diagrams for the eight stellar occultations by (28978) Ixion: (a) 17 August 2020, (b) 13 October 2020, (c) 28 April 2021, (d) 20 May 2021, (e) 17 August 2021, (f) 2 June 2022, (g) 30 June 2022, and (h) 28 July 2023. Each chord is shown in a different colour, corresponding to the observing sites listed in the legends. Positive detections define the limb of the body, while continuous full-length chords represent negative observations that constrain the maximum extent of the limb. The x- and y-axes correspond to the sky-plane coordinates f and g (in km), oriented along the fundamental plane of the occultation. For the single-chord events (e and f), the limb shape was fixed to the global solution; only the astrometric offsets (f, g) were determined. The red segments at the ends of the chords represent the ingress and egress timing uncertainties. An elliptical fit was applied in each case, with the best-fit solution (1σ) shown. The grey-shaded regions around the ellipses indicate the 1σ confidence domains obtained from the fitting procedure. The corresponding parameters are listed in Table 4. The black arrow indicates the direction of the shadow motion, while the arrows labelled N and S denote celestial north and south, respectively. |
| In the text | |
|
Fig. E.3 Orthogonal (normal) residuals of the chord extremities with respect to the global limb solution, plotted as a function of position angle in the ellipse-aligned frame. Residuals are measured along the local normal to the best-fitting ellipse, ensuring a geometrically consistent assessment of deviations over the entire limb. Each colour and marker corresponds to a different occultation epoch (same coding as in Fig. 2). No clear systematic trend with position angle is observed, indicating that the residuals are consistent with random scatter within the adopted observational and model uncertainties. The offsets observed for the 28 April 2021 and 30 June 2022 epochs are discussed in Sect. 5 and may be associated with changes in the projected figure of the body at different rotational phases or aspect angles. |
| In the text | |
Current usage metrics show cumulative count of Article Views (full-text article views including HTML views, PDF and ePub downloads, according to the available data) and Abstracts Views on Vision4Press platform.
Data correspond to usage on the plateform after 2015. The current usage metrics is available 48-96 hours after online publication and is updated daily on week days.
Initial download of the metrics may take a while.