Open Access
Fig. E.0
Download original image
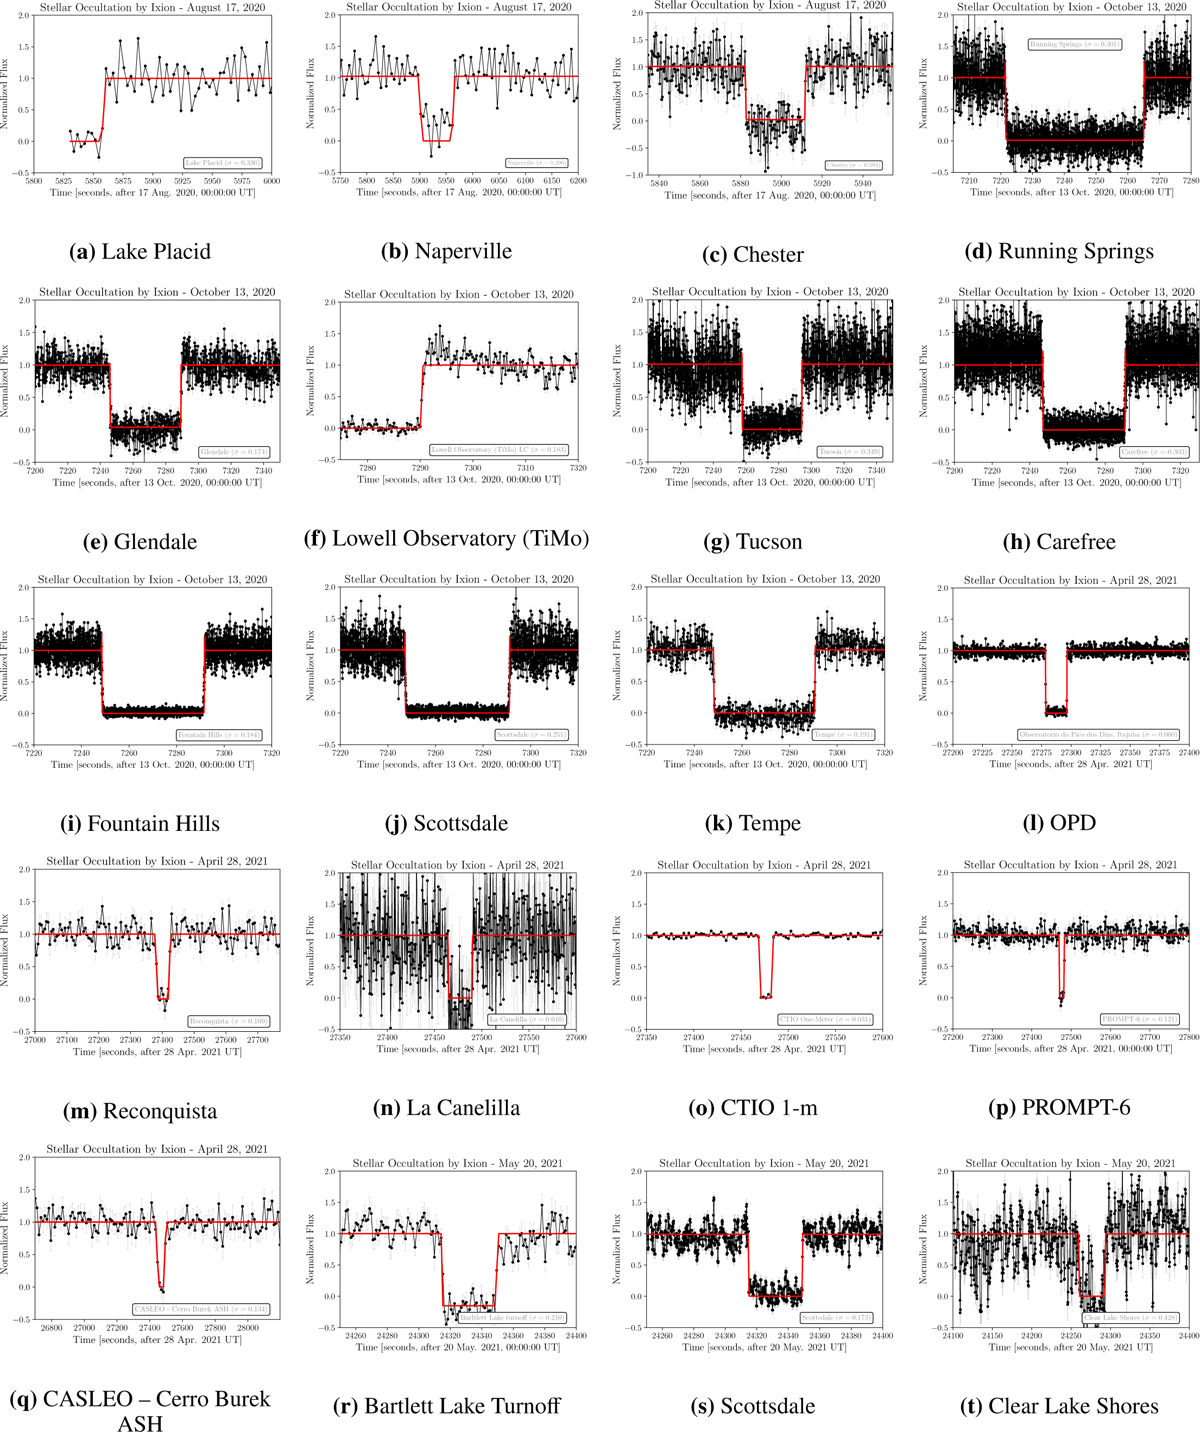
Normalised flux light curves of the stellar occultations by (28978) Ixion. The black points represent the observed flux with uncertainties, and the red line shows the best-fit model. The x-axis represents the time in seconds relative to 00:00:00 UT on the observation date, and the y-axis shows the normalised flux.
Continued.
Current usage metrics show cumulative count of Article Views (full-text article views including HTML views, PDF and ePub downloads, according to the available data) and Abstracts Views on Vision4Press platform.
Data correspond to usage on the plateform after 2015. The current usage metrics is available 48-96 hours after online publication and is updated daily on week days.
Initial download of the metrics may take a while.