Fig. 4
Download original image
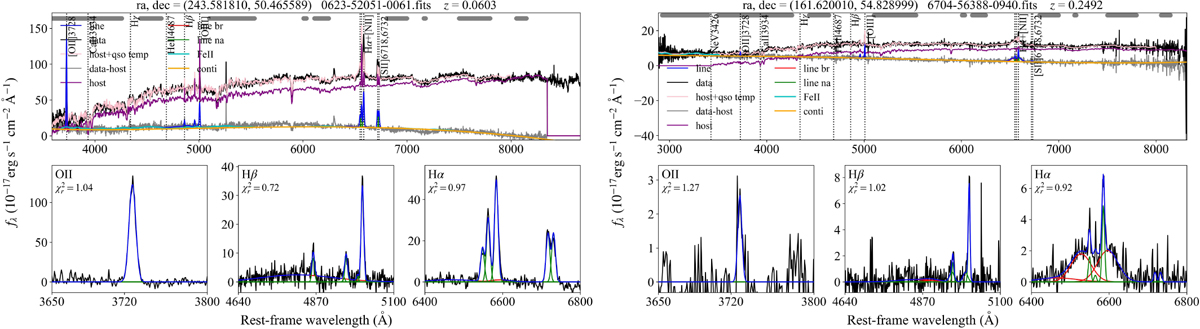
Optical spectra of 4FGL J1614.4+5028 (a) and 4FGL J1046.0+5448 (b) modeled with QSOFITMORE. The spectral data are shown with the black line. The red and green lines represent broad and narrow components of the emission line, and the modeled continuum is plotted with the orange line. The blue line is the sum of all the components. The purple line represents the host galaxy component. The horizontal gray dashes at the top of the plots denote the line-free wavelength regions selected to model the continuum emission. It is noteworthy that both spectra are dominated by absorption lines. However, in (a), after subtracting the host galaxy component, the Hα line only has a narrow component, thus is classified as a BL Lac. In contrast, in (b), after subtracting the host galaxy component, the Hα line still exhibits a prominent broad component, and is classified as a FSRQ. Both spectra are from SDSS-DR16.
Current usage metrics show cumulative count of Article Views (full-text article views including HTML views, PDF and ePub downloads, according to the available data) and Abstracts Views on Vision4Press platform.
Data correspond to usage on the plateform after 2015. The current usage metrics is available 48-96 hours after online publication and is updated daily on week days.
Initial download of the metrics may take a while.