| Issue |
A&A
Volume 707, March 2026
|
|
|---|---|---|
| Article Number | A347 | |
| Number of page(s) | 11 | |
| Section | Catalogs and data | |
| DOI | https://doi.org/10.1051/0004-6361/202557975 | |
| Published online | 24 March 2026 | |
Classification of blazar candidates of uncertain type and estimation of Doppler factors
1
Center for Astrophysics, Guangzhou University,
Guangzhou
510006,
China
2
Dipartimento di Fisica e Astronomia “G. Galilei”, Università di Padova,
Via F. Marzolo 8,
35131
Padova,
Italy
3
Greater Bay Brand Center of the National Astronomical Data Center,
Guangzhou
510006,
China
4
Astronomy Science and Technology Research Laboratory of Department of Education of Guangdong Province,
Guangzhou
510006,
China
★ Corresponding author: This email address is being protected from spambots. You need JavaScript enabled to view it.
; This email address is being protected from spambots. You need JavaScript enabled to view it.
Received:
4
November
2025
Accepted:
4
February
2026
Abstract
Context. The Fermi Gamma-ray Large Area Telescope Fourth Source Catalog Data Release 4 (4FGL-DR4) classifies 3935 γ-ray sources as blazars. They are divided into two types, based on the equivalent width (EW): flat spectrum radio quasars (FSRQs) and BL Lacertae objects (BL Lacs). However, 1625 sources lack optical spectroscopic data and are tentatively classified as blazar candidates of uncertain type (BCUs).
Aims. This work aims to spectroscopically classify a sample of BCUs, determine the redshifts, and estimate the masses of the central supermassive black holes (MBH) and the Doppler factors (δ) of the jets, in order to better understand their physical properties and provide valuable classifications for Cherenkov observatories.
Methods. We cross-matched BCUs from the 4FGL-DR4 with the Sloan Digital Sky Survey Data Release 16 (SDSS-DR16) to obtain optical spectra. Sources were classified based on the EW of emission lines. For spectra with broad emission lines, MBH was estimated using the virial method. For absorption line dominated spectra, MBH was derived from the stellar velocity dispersion of the host galaxy. The δ was estimated for FSRQs using an empirical relation between their γ-ray and broad-line region luminosities.
Results. We obtained and analyzed optical spectra for the candidate counterparts of 86 BCUs. Based on the spectral features, we confirmed 35 sources as FSRQs, 45 as BL Lacs, 3 as low-ionization narrow emission-line regions (LINERs), and 3 as regular elliptical galaxies, and we secured redshifts for 54 objects. We corrected the erroneous SDSS redshift for the counterparts of 4FGL J1047.9+0055 from 0.252 to 0.642. The black hole masses in log[MBH/M⊙)]range from 7.07 to 9.22. The derived δ for 35 FSRQs spans from 3.62 to 35.43, with a mean value ⟨δ⟩ of 13.41. The distribution of our classified sources in the γ-ray luminosity–photon index plane is consistent with that of the known blazars.
Conclusions. Our spectroscopic analysis provides reliable classifications and key physical parameters for a large sample of BCUs. This work offers a crucial dataset for future statistical studies of blazars, their jet physics, and the connection between accretion processes and jet power.
Key words: Galaxies: active / BL Lacertae objects: general / galaxies: jets
© The Authors 2026
 Open Access article, published by EDP Sciences, under the terms of the Creative Commons Attribution License (https://creativecommons.org/licenses/by/4.0), which permits unrestricted use, distribution, and reproduction in any medium, provided the original work is properly cited.
This article is published in open access under the Subscribe to Open model. This email address is being protected from spambots. You need JavaScript enabled to view it. to support open access publication.
1 Introduction
As the extreme subclass of active galactic nuclei (AGNs), blazars show many particular properties, such as rapid and high-amplitude spectral flux variabilities, high and variable polarizations, apparent superluminal motions, and high-energy emissions (Moore & Stockman 1981; Wills et al. 1992; Fan et al. 1997, 2016, 2021; Romero et al. 2000; Aller et al. 2003; Andruchow et al. 2005; Abdo et al. 2010b; Zheng & Zhang 2011; Zheng et al. 2014; Xiao et al. 2022; Yang et al. 2022a, 2026; Ballet et al. 2023). Based on the rest-frame equivalent width (EW) of their optical emission lines, blazars are divided into two subclasses: those with EW < 5 Å are classified as BL Lacertae objects (BL Lacs), while those with EW ≥ 5 Å are classified as flat spectrum radio quasars (FSRQs; Stickel et al. 1991).
Since its launch in 2008, the Fermi Large Area Telescope (Fermi/LAT) has greatly advanced the study of high-energy radiation. The latest incremental version, Data Release 4 of the Fermi/LAT Fourth Source Catalog (4FGL-DR41; Abdo et al. 2010a; Ballet et al. 2023), was released in July 2023, and it includes a total of 7194 γ-ray sources. However, γ-ray observations alone provide only high-energy information. Many physical properties, such as jet structure, black hole mass, and accretion disk properties, require multiwavelength observations for a thorough understanding. Therefore, the association of these γ-ray sources with counterparts observed in other bands is very important. In the fourth Fermi/LAT AGN catalog (4LAC), the classification of a γ-ray source as a blazar relies predominantly on its optical spectrum (Ajello et al. 2020). In particular, optical spectra from intensive monitoring programs are the primary resource used for identification in the 4LAC (e.g., Shaw et al. 2013a,b; Massaro et al. 2014, 2015b,c,d; Paggi et al. 2014; Ricci et al. 2015; Landoni et al. 2015; Chiaro et al. 2016; Álvarez Crespo et al. 2016a; Álvarez Crespo et al. 2016b,c; Paiano et al. 2017a,b,c, 2019; Peña-Herazo et al. 2017; Marchesi et al. 2018; de Menezes et al. 2019; Marchesini et al. 2019). The optical classifications compiled in the Roma-BZCAT (Multifre-quency Catalogue of Blazars) (Massaro et al. 2015a) are also adopted. The BZCAT classifications are based on optical spectroscopic campaigns and published literature rather than on an independent reclassification. Additionally, literature and online databases serve as supplementary resources, for example the Sloan Digital Sky Survey (SDSS; Ahn et al. 2012; Massaro et al. 2014) and the 6dF Galaxy Survey (Jones et al. 2009). In this way, 3935 γ-ray sources in the 4FGL-DR4 were classified as blazars. Among them, 1490 are identified as BL Lacs and 820 as FSRQs. The remaining 1625 sources are tentatively classified as blazar candidates of uncertain type (BCUs). BCUs are considered candidate blazars because, during the association process, they are found to be associated with BZU objects (blazars of uncertain or transitional type) in the BZCAT list or exhibit a typical two-humped, blazar-like spectral energy distribution (Ajello et al. 2020). The large number of BCUs (∼40%) significantly hampers efforts to explore relativistic jets and other related problems.
A thorough spectroscopic investigation of their counterparts is particularly critical as it will allow us to confirm the classification of these BCUs and determine redshifts. For instance, Paiano et al. (2019) performed spectroscopic observations of 28 BCUs at the 10.4 m Gran Telescopio Canarias, leading to reliable classification and redshift determination for each source. Marchesini et al. (2019) reported the spectra of 36 BCUs, among which 23 sources were confirmed as BL Lacs and 7 as FSRQs. Peña-Herazo et al. (2021b) reported the optical spectra of 64 targets observed during their follow-up spectroscopic campaign; 62 of these sources were classified as BCUs in the Fermi/LAT catalog. Their analyses classified 33 as BL Lacs, 11 as FSRQs, and 18 as blazars with absorption-line-dominated spectra. In addition to direct optical spectroscopic observations, cross-matching BCUs with open online databases and historical literature is also an effective method. For this work, we cross-matched BCUs from the 4FGL-DR4 with the 16th data release of SDSS (SDSS-DR162; Ahumada et al. 2020), thus obtaining optical spectra for their candidate counterparts. This yielded a sample of 86 optical spectra.
Blazars account for a large fraction in the 4FGL-DR4, making the classification of BCUs particularly valuable for blazar studies. In particular, the Doppler factor (δ) represents a key property of their jets, but it cannot be measured directly through observations. A variety of indirect approaches have been suggested to estimate the Doppler factor. For instance, Lähteenmäki & Valtaoja (1999) derived it from variations in radio flux density. For some γ-ray loud blazars, both their γ-ray emissions and variability timescales have been applied for Doppler factor estimation (Mattox et al. 1993; von Montigny et al. 1995; Cheng et al. 1999; Fan et al. 1999, 2013, 2014; Fan 2005; Pei et al. 2022). In addition, broadband SED modeling has been employed by Ghisellini et al. (2014) and Chen (2018) to determine Doppler factors. By comparing observed and intrinsic brightness temperatures, Liodakis et al. (2017) and Liodakis et al. (2018) derived variability Doppler factors. Moreover, Zhang et al. (2020) proposed a new approach to estimate Doppler factors for Fermi blazars with available broad-line and γ-ray luminosities, which was updated by Zhang et al. (2023) (see also Chen et al. 2024). Furthermore, Ye & Fan (2021) estimated Doppler factors based on the relationship between core and extended radio luminosities. Overall, different methods rely on distinct assumptions, which in turn yield different estimates of the Doppler factor. In this work, we adopted the method proposed by Zhang et al. (2020) to estimate the Doppler factors for BCUs with broad emission lines.
The paper is organized as follows. Section 2 details the procedures for obtaining and processing the optical spectra. In Section 3 we discuss the classification of the optical spectra and two techniques for determining MBH, and the estimation of δ. Finally, in Sect. 4 we provide a summary. We assume a flat universe with h = ΩΛ = 0.7 throughout the paper.
Cross-matched Fermi BCU and corresponding SDSS spectra.
2 The samples and methods
2.1 Positional cross-matching and counterpart identification
To search for the optical spectra of the candidate counter-parts, we first conducted a catalog-based matching procedure. We began with a preliminary sample of 1625 BCUs listed in the 4FGL-DR4 catalog. For each BCU, the association name provided in the 4FGL-DR4 catalog was used to search for cross-identifications (cross-IDs) in the NASA/IPAC Extragalactic Database (NED)3. From NED, we collected the preferred source coordinates and the corresponding cross-IDs, including those with SDSS designations. Using these SDSS names and positions, we queried the SDSS-DR16 database to obtain the available optical spectra.
For each spectrum, Table 1 lists the associated counterpart coordinates provided in the 4FGL catalog, the Fermi/LAT source centroid coordinates, and the matched SDSS spectroscopic coordinates. To obtain a more robust and quantitatively reliable identification of the optical counterparts, we computed the angular separation θ between two sky positions (RA1, Dec1) and (Dec2, RA2) using the haversine spherical-distance formula:
![Mathematical equation: $\theta = 2\arcsin \left[ {\sqrt {{{\sin }^2}\left( {{{\Delta {\rm{Dec}}} \over 2}} \right) + \cos \left( {{{{\mathop{\rm Dec}\nolimits} }_1}} \right)\cos \left( {{{{\mathop{\rm Dec}\nolimits} }_2}} \right){{\sin }^2}\left( {{{\Delta {\rm{RA}}} \over 2}} \right)} } \right],$](/articles/aa/full_html/2026/03/aa57975-25/aa57975-25-eq1.png)
where ∆RA = RA2 − RA1 and ∆Dec = Dec2 − Dec1.
Because the localization accuracy of the Fermi/LAT varies significantly with photon energy, it is essential to account for the instrument's point spread function (PSF). The 68% containment radius is approximately ~ 5° at 100 MeV, improves to ~0.8° at 1 GeV, and approaches an asymptotic value of ∼0.1° above 20 GeV (Atwood et al. 2009; Abdo et al. 2009; Abdollahi et al. 2020). Considering the broad energy-dependent PSF and the fact that the γ-ray and optical emitting regions are intrinsically different and may not be perfectly co-spatial, we applied the following selection criteria: (1) The angular separation (AngSep1−3) between the 4FGL source centroid (RA1, Dec1) and the SDSS spectral position (RA3, Dec3) must be smaller than the 95% error radius, θ95, defined as the geometric mean of the semimajor and semiminor axes of the source location ellipse in the 4FGL catalog. (2) The angular separation (AngSep2−3) between the associated counterpart position (RA2, Dec2) reported in the 4FGL catalog and the SDSS spectral position (RA3, Dec3) must be smaller than 2′′, given that the positional uncertainty of SDSS spectra is typically at the arc-second level. (3) The association probability (either Bayesian or likelihood-ratio probability) given in the 4FGL catalog must be larger than 0.8, ensuring a reliable identification of the true counterparts. After applying all the selection criteria, we obtained a final sample of 86 optical spectra for the counterparts of the BCUs (see Table 1).
Properties of emission and absorption lines.
2.2 Spectral line identification and redshift measurement
As shown in Table 2, the 4FGL name and their corresponding Plate-MJD-FiberID from SDSS are presented in Col. (1) and Col. (2). Column (3) shows the signal-to-noise ratio (S/N) of the spectrum, calculated as the median of the flux-to-error ratio at each wavelength point. Additionally, we identified the emission and absorption lines in the spectra of counterparts of the 54 BCUs (see Appendix A) and fitted each line with a single Gaussian. The Gaussian center was adopted as the observed wavelength, and by comparing it with the rest wavelength, we determined their redshifts (Col. 9 in Table 2). This method works well for lines [O II], [O III], and Ca II H&K, for example, which are well fit by a single Gaussian, but is unstable for broad lines, such as Mg II and C IV. In cases where only a single emission line is present in the spectrum, its identification is ambiguous, and therefore we referred to the redshift values provided by SDSS, which were obtained by fitting the spectrum with multiple templates (e.g., galaxy and quasar templates), recording all possible redshifts, and choosing the one with the smallest chi-square(χ2; Bolton et al. 2012). In Fig. 1, we show the comparison between our redshift result with those from SDSS, and find that the redshift of J1047.9+0055 reported as 0.25 in SDSS, should be 0.6421 from our investigation.
Among the 86 optical spectra of the candidate counterparts, we measured redshifts for 54 sources. Of these, 19 spectra dominated by absorption lines (from the host galaxy) have an average redshift of 0.26, while the other 35 spectra dominated by broad emission lines (from the nuclear region) have an average redshift of 1.17. There is a significant difference in redshift between these two groups because for a distant (high-redshift) source to be detected, it must have a very high luminosity. This strong emission can arise either from the source’s intrinsically high luminosity or from Doppler boosting, which can enhance the observed emission by several orders of magnitude. In both cases, the boosted or intrinsically strong nuclear radiation over-shines the host galaxy starlight, leading to optical spectra that lack prominent absorption features. Therefore, when the optical spectrum is dominated by the host galaxy, it generally indicates either a nearby source or a source with relatively weak Doppler boosting. As shown in Appendix A, the low-redshift candidate counterparts J1139.6+1149 (z = 0.08), J1612.2+2828 (z = 0.05), J1614.4+5028 (z = 0.06), and J1725.4+5254 (z = 0.06) all exhibit significant absorption line features in their optical spectra, which are characteristic of their host galaxies. When the redshift is slightly higher, as in the candidates J0029.4+2051 (z = 0.37), J0147.6+1547 (z = 0.38), J0237.1-0714 (z = 0.36), J1403.6+3606 (z = 0.25), J1017.3+5204 (z = 0.38), and J1017.4+2538 (z = 0.42), the absorption line features in their optical spectra become much weaker. At even higher redshifts, detecting host galaxy absorption lines in the spectra of such counterparts becomes even more challenging.
2.3 Emission line spectra
In our recent works (Chen et al. 2024, 2025), we analyzed publicly available optical spectra of Fermi blazars using QSOFITMORE (Fu 2021). QSOFITMORE is an extended version of PYQSOFIT (Guo et al. 2018), which employs spectral models, Fe templates, and fitting functions to data in the χ2 test. Compared to PYQSOFIT, QSOFITMORE is not limited to SDSS spectra and can be applied to optical spectra in arbitrary data formats. For this work, we adopted the same tool to derive the emission line profiles of the optical spectra of BCU counterparts identified through catalog matching. A brief introduction and the key parameters required for data processing are provided below. Detailed explanations of this method are provided in the works (Guo et al. 2018; Shen et al. 2019; Fu 2021).
Initially, we corrected the target spectra for Galactic dust reddening and extinction using the extinction curves from Cardelli et al. (1989) and the dust map by Schlegel et al. (1998). Then to exclude interference from the host galaxy component, it was subtracted from the target spectra using the principal component analysis method described by Yip et al. (2004a,b). To fit the line-free continuum efficiently across the entire spectrum, we considered four components: a power law, a third-order polynomial, and templates for the optical and UV Fe II emissions (Boroson & Green 1992; Vestergaard & Wilkes 2001; Shen et al. 2019). The power law provides an empirical approximation of the AGN continuum, including contributions from the accretion disk and jet. The third-order polynomial adds flexibility to absorb broad curvature or atypical continuum shapes beyond what a simple power law can reproduce. The optical and UV Fe II templates model the Fe II emission complexes in the optical and ultraviolet, ensuring accurate continuum placement and reliable measurements of lines such as Hβ, [O III], and Mg II.
After fitting the continuum, we extracted the properties of the emission lines by subtracting the best-fit continuum from the target spectra. Specifically, the Hα and Hβ emission lines were fitted within the wavelength ranges [6400, 6800] Å and [4640, 5100] Å, respectively. The broad components of those lines were modeled using three Gaussian profiles, whereas the narrow components, along with the [O III] λλ 4959, 5007, [N II] λλ 6549, 6585, and [S II] λλ 6718, 6732 lines were each modeled using a single Gaussian profile (Shen et al. 2019). For the [O II] 3728 line, the fitting was performed within the wavelength range [3650, 3800] Å, using a single Gaussian profile. For the Mg II and C IV lines, the fittings were conducted within the wavelength ranges [2700, 2900] Å and [1500, 1700] Å, respectively. The broad components of the Mg II line were fitted with two Gaussian profiles, while a single Gaussian was used for the narrow component. The broad C IV line was modeled with three Gaussian profiles (Shen et al. 2019). In this way, we were able to obtain the EWs of all the emission lines. For the broad emission lines, their flux and full width at half maximum (FWHM) values are presented in Table 3.
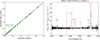 |
Fig. 1 Left: comparison between the redshift reported in the SDSS catalog and those determined in this work based on emission or absorption lines. The dashed line represents y = x. Right: spectrum of BCU source 4FGL J1047.9+0055, whose redshift is reported as z = 0.252 in SDSS-DR16. However, based on the detection of multiple emission lines, its correct redshift is z = 0.642. |
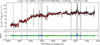 |
Fig. 2 SDSS optical spectrum of 4FGL J2148.9-0121 (black) is shown alongside the results of the stellar population synthesis performed with pPXF (red). The bottom panel displays the residuals of the fit. Wave-length regions excluded from the fit to avoid emission lines are marked by the gray-shaded columns. |
2.4 Absorption-line spectra
The optical spectra of some counterparts exhibit prominent absorption line features, such as the Ca II H&K doublet, which primarily originate from the stellar population of their host galaxies. The stellar velocity dispersion (σ∗) of those galaxies is a key parameter as it has been shown to correlate strongly with the masses of the central supermassive black hole (MBH) in numerous studies (Ferrarese & Merritt 2000; Gültekin et al. 2009; Kormendy & Ho 2013). To measure σ∗, we employed the penalized PiXel Fitting (pPXF) method developed by Cappellari & Emsellem (2004). This tool uses a maximum penalized likelihood to calculate the line-of-sight velocity distribution (LOSVD) from kinematic data in pixel space. For this work we adopted a large group stellar population synthesis model from Vazdekis et al. (2010), a spectral resolution of full width at half maximum (FWHM) = 2.5 Å, and a fitting wavelength range of [3525, 7500] (Sahakyan et al. 2023). We masked the emission line regions before fitting and modified the galaxy spectra to rest-frame system. Finally, σ∗ and the corresponding 1σ uncertainties were derived from the best-fit spectra; they are listed in Table 4, with an example shown in Fig. 2.
Emission-line black hole mass.
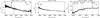 |
Fig. 3 (a) SDSS optical spectrum of 4FGL J0943.7+6137, a source classified as a FSRQs, showing a quasar-like spectrum along with labels of some emission lines. (b) Optical spectrum of 4FGL J1223.0+1100, a classical BL Lac object, showing the almost featureless blue spectrum; (c) SDSS optical spectrum of 4FGL J1614.4+5028, which shows absorption and emission lines from the host galaxy. |
3 Results and discussions
3.1 Spectral classification of the counterparts
We used optical spectroscopy to classify the candidate counterparts of BCUs. The 86 spectra obtained can be divided into three types. The first type shows strong broad emission lines (Fig. 3a), the second type shows no emission or absorption features (Fig. 3b), and the third type is dominated by absorption lines (Fig. 3c).
Among the three spectral categories, the first group comprises 33 sources whose optical spectra display clear broad emission lines with EW > 5Å; these objects are classified as FSRQs. The second group includes 32 sources with featureless optical spectra. To minimize the impact of noise, only featureless spectra with a signal-to-noise ratio exceeding 5 are considered in this work. We list their information in the final part of Table 2, and present their spectra in the final part of Appendix A. As their spectra exhibit no identifiable emission or absorption features, we do not report or use any redshift value for these objects. While we cannot formally exclude the possibility of a misassociation in individual cases, the requirement of a high association probability (Prob > 0.8), together with the consistency of the counterparts across multiple wavelengths, makes it statistically unlikely that the optical sources identified here are normal quiescent elliptical galaxies lacking relativistic jets. For sources showing featureless spectra, the absence of spectral features is interpreted as the result of a dominant nonthermal continuum, which overwhelms both emission and absorption lines, as expected for classical BL Lac objects. We therefore classify the 32 sources as BL Lacs, while noting that they may represent transition objects between BL Lacs and FSRQs.
The third group consists of sources whose optical spectra are dominated by absorption features, and they are further divided into two subclasses. For example, we find that 4FGL J1046.0+5448 and 4FGL J2330.4+1230 exhibit clear broad emission lines in their optical spectra (see Appendix A). After subtracting the host galaxy component using QSOFITMORE, prominent broad emission line features remain in both cases. As illustrated in Fig. 4(a), the sources show no broad emission lines after host galaxy subtraction, whereas Fig. 4(b) shows an example in which a clear broad Hα component persists after subtraction. Based on this criterion, we classify 4FGL J1046.0+5448 and 4FGL J2330.4+1230 as FSRQs.
For the remaining 19 sources whose optical spectra are dominated by absorption features, we follow the optical spectroscopic definition of BL Lacs proposed by Marcha et al. (1996). Specifically, these sources are classified as BL Lacs if they show emission line rest-frame EW < 5 Å and exhibit a 4000 Å break contrast < 0.4 (see also Healey et al. 2008; Shaw et al. 2009, 2013a,b). The 4000 Å break contrast is defined as C = ( f+ − f−)/ f+, where f− and f+ are the average flux densities measured in the rest-frame wavelength intervals 3750 3950 Å (blue side) and 4050 − 4250 Å (red side), respectively.−The measured break contrasts are listed in Table 4. Based on this criterion, 13 sources are classified as BL Lacs, while 6 sources exhibit break contrasts larger than 0.4, namely J0112.8-0253, J1139.6+1149, J1212.1+6412, J1416.0+1320, J1541.1+3451, and J1614.4+5028.
These six sources with strong stellar breaks are classified based on their detailed spectroscopic properties. Three sources (J0112.8-0253, J1416.0+1320, and J1541.1+3451) show no detectable emission lines and exhibit strong stellar breaks. We therefore classify them as regular elliptical galaxies. Given the absence of any detectable nonthermal emission, these sources may not be considered as confirmed counterparts of the associated Fermi sources. They may instead represent chance associations within the 95% Fermi error ellipses, or they can be the proper counterpart, but in an extremely low-activity state where the jet emission is not distinguishable. The remaining three sources (J1139.6+1149, J1212.1+6412, and J1614.4+5028) exhibit clear narrow emission lines, indicative of nuclear activity. For J1212.1+6412 and J1614.4+5028, we used QSOFITMORE to measure the narrow line fluxes and placed them on the standard BPT diagnostic diagram (Baldwin et al. 1981). We obtain the following: J1212.1+6412: log([OIII]/Hβ) = 0.57, log([NII]/Hα) = 0.29, log([SII]/Hα) = 0.19; J1614.4+5028: log([OIII]/Hβ) = 0.64, log([NII]/Hα) = 0.33, log([SII]/Hα) = 0.20. According to the classification schemes of Kewley et al. (2001, Kewley et al. 2006), these line ratios place both sources in the low-ionization narrow emission-line region (LINER). For J1139.6+1149, where Hβ is not reliably detected, we adopt alternative diagnostic ratios that do not require Hβ. We measure log([NII]/Hα) = 0.57 and log([SII]/Hα) = 0.37, which securely place the source in the AGN region rather than the H II region. In addition, its low excitation, characterized by log([OIII]/[OII]) = −0.35, further supports a LINER classification. We therefore classify J1139.6+1149, J1212.1+6412, and J1614.4+5028 as LINERs.
In this way, we classified the candidate counterparts of the 86 BCUs as follows: 35 as FSRQs, 45 as BL Lacs, 3 as LINERs, and 3 as regular elliptical galaxies. Optical spectroscopic observations of BCUs have been widely reported in the literature (e.g., Klindt et al. 2017; Peña-Herazo et al. 2020, 2021a; Goldoni et al. 2021; Olmo-García et al. 2022; García-Pérez et al. 2023; Kasai et al. 2023; D’Ammando et al. 2024; Marais & van Soelen 2024; Álvarez Crespo et al. 2025; Rajput et al. 2025). Three sources in our sample have also been observed spectroscopically at other epochs and reported in the literature, allowing a direct comparison between independent classifications obtained at different times. For example, Olmo-García et al. (2022) obtained optical spectroscopy of 4FGL J0130.6+1844 with the 3.6 m Telescopio Nazionale Galileo (TNG) and reported a featureless spectrum, leading to its classification as a BL Lac. Subsequently, García-Pérez et al. (2023) reported a featureless optical spectrum for 4FGL J1441.7+1836 based on observations with the 2.1 m telescope at the National Astronomical Observatory of San Pedro Mártir, and classified the source as a BL Lac. More recently, Álvarez Crespo et al. (2025) observed 4FGL J1229.1+5521 using the TNG and detected prominent emission lines, allowing a secure redshift measurement of z = 1.40 and a classification as a FSRQ. Our classifications are consistent fully with theirs.
Absorption-line black hole mass.
3.2 Comparison with known FSRQs and BL Lacs
Ghisellini et al. (2009) observed a correlation between the log-arithm of γ-ray luminosity (log Lγ) and the spectral index (αγ), and found that FSRQs and BL Lacs exhibit distinct distributions in terms of log Lγ and αγ. As shown in Fig. 5, we plot the log Lγ and photon index (αph, where αph = αγ + 1) for both confirmed blazars in the 4FGL catalog and the 35 FSRQs and 45 BL Lacs classified in this work. The results show that BCUs classified as FSRQs in our work are predominantly located in the region occupied by the known FSRQs, while BCUs identified as BL Lacs are found in the area of the known BL Lacs.
To effectively separate these two classes, we employed the linear discriminant analysis (LDA; Fisher 1936) and the support vector machine (SVM; Cortes & Vapnik 1995) to establish dividing lines. LDA is a classic supervised learning method that tries to find a linear combination of features that best separates different classes. It assumes that the data from each class follow a normal distribution and works by maximizing the difference between classes while minimizing the difference within each class to find the best decision boundary. The accuracy obtained by LDA was 91.55%, and the corresponding decision boundary is αph = −0.153 log Lγ + 9.26. Additionally, in the SVM method we used a linear kernel function based on the distribution of the sample, and cross-validation was performed to determine the optimal penalty parameter (C = 10). Then we obtained a dividing line αph = −0.140 log Lγ + 8.73 with an accuracy rate of 91.70%, which is consistent with Yang et al. (2022b). Both methods showed high accuracy in distinguishing FSRQs and BL Lacs.
While most of our confirmed blazars follow the general separation between FSRQs and BL Lacs in the log Lγ–αph plane, a partial overlap between the two populations is still present. In particular, some sources located below the adopted dividing lines are nevertheless classified as FSRQs based on their optical spectroscopic properties. Their optical spectra clearly reveal the presence of broad emission lines, indicating a FSRQ-like central engine. In contrast, their γ-ray emission is relatively weak and characterized by harder photon indices, resembling the typical properties of BL Lacs. This apparent inconsistency suggests that such sources may represent transition-type blazars, exhibiting mixed characteristics of both FSRQs and BL Lacs. In addition, redshift may also play an important role in shaping the observed γ-ray spectral properties. At lower redshifts, the attenuation of high-energy photons by the extragalactic background light (EBL) is weaker, allowing the γ-ray spectra to appear harder. As a consequence, nearby FSRQs may display BL Lac-like γ-ray features even though they retain intrinsic FSRQ characteristics.
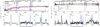 |
Fig. 4 Optical spectra of 4FGL J1614.4+5028 (a) and 4FGL J1046.0+5448 (b) modeled with QSOFITMORE. The spectral data are shown with the black line. The red and green lines represent broad and narrow components of the emission line, and the modeled continuum is plotted with the orange line. The blue line is the sum of all the components. The purple line represents the host galaxy component. The horizontal gray dashes at the top of the plots denote the line-free wavelength regions selected to model the continuum emission. It is noteworthy that both spectra are dominated by absorption lines. However, in (a), after subtracting the host galaxy component, the Hα line only has a narrow component, thus is classified as a BL Lac. In contrast, in (b), after subtracting the host galaxy component, the Hα line still exhibits a prominent broad component, and is classified as a FSRQ. Both spectra are from SDSS-DR16. |
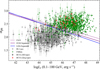 |
Fig. 5 γ-ray luminosity and photon index plane for confirmed blazars from the Fermi/LAT catalog and for the classifications of 117 BCUs from our work. The straight lines indicate the boundaries between FSRQs and BL Lacs: αph = −0.127 logLγ + 8.18 (purple dashed) is from Chen (2018), αph = −0.140 logLγ + 8.73 (purple solid) for SVM, and αph = −0.153 logLγ + 9.26 (blue solid) for LDA. |
3.3 Black hole masses
For counterparts exhibiting broad emission lines, it is assumed that the line width is dominated by the gravitational potential of the central supermassive black hole. Consequently, the FWHM of the broad lines can be taken as representative of the virial velocity. Additionally, the continuum luminosity can serve as a proxy for the BLR radius. This allows one to estimate the MBH of emission line blazars from the optical spectra using the following formula (Shen et al. 2011):
 (1)
(1)
where λLλ represents the continuum luminosity, typically taken as 5100 Å for Hβ, 3000 Å for Mg II, and 1350 Å for C IV. According to McLure & Dunlop (2004), the calibration coefficients (α, β) are (0.672, 0.61) for Hβ and (0.505, 0.62) for Mg II. For C IV, the coefficients (0.660, 0.53) are from Vestergaard & Peterson (2006).
Shen et al. (2011) also proposed an empirical formula to calculate MBH based on the FWHM of the Hα line and its luminosity,
 (2)
(2)
where  is the total Hα line luminosity.
We calculated the broad-line luminosity using the formula (Fan et al. 2013):
 (3)
(3)
Here  is the luminosity distance, and λF(λ) represents the flux density in units of erg cm−2 s−1. For objects with multiple MBH measurements, we used the geometric mean as the MBH value. We calculated the black hole masses for the 35 FSRQs, as shown in Table 3.
For the 19 sources with measured stellar velocity dispersion (13 BL Lacs, 3 LINERs, and 3 regular elliptical galaxies), we calculated the MBH using the following empirical relation (Gültekin et al. 2009) (see the results listed in Table 4):
 (4)
(4)
Finally, we obtained that the logarithm of MBH, log(MBH/M⊙), ranges from 7.07 to 9.22, with an average value of log(MBH/M⊙) = 8.29 for the 54 sources. The distribution of these values is illustrated in Fig. 6. For the calculation of MBH uncertainties, we first used QSOFITMORE to obtain each fitting parameter and its associated error. In QSOFITMORE, the errors are derived using a Monte Carlo simulation method. In this way, random noise is added to the original spectral data to simulate various measurement errors. After multiple iterations, the uncertainties of the parameters are computed. After obtaining these fitted parameters, we used the Python uncertainties package for error propagation. This package automatically handles calculations with uncertainties, ensuring that the errors of the individual parameters are correctly propagated to the final MBH.
Paliya et al. (2021) analyzed the optical spectra of 1077 Fermi blazars, obtained from the historical literature and SDSS through cross-matching, and reported their MBH. The log (MBH/M⊙) ranges from 6.35 to 10.2, with a mean of 8.59. Among these 1077 sources, 153 are classified as BCUs in the Fermi catalog. Within this subset, 37 sources are also included in our matching catalog. However, for nine of these sources (J0109.3+2401, J0749.3+4453, J0922.6+4454, J1241.3+4236, J1243.0+3950, J1336.2+2053, J1623.4+0858, J2226.6+0210, and J2228.5+2211), reliable MBH estimates were not possible due to their weak absorption or emission lines, even though σ∗ measurements were attempted with pPXF. Therefore, we compared MBH for the remaining 28 sources in common, as shown in Fig. 6. In the right panel, the dashed line represents y = x. Most masses cluster near this line, indicating a general consistency between the two studies. Notably, black hole masses derived from the absorption line spectra show better agreement, as both studies employed spectral fitting with pPXF to determine the stellar velocity dispersion. However, for emission line spectra, the discrepancies are more pronounced. This is likely due to the use of different spectral fitting tools: Paliya et al. applied PYQSOFIT (Guo et al. 2018), whereas we utilized QSOFIT-MORE (Fu 2021), which may lead to variations in the derived parameters. Additionally, the classifications and redshifts for the 28 common sources between our work and Paliya (2022) are identical.
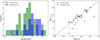 |
Fig. 6 Left: distribution of black hole masses (MBH) for sources with emission line (green) and absorption line (blue) dominated spectra in this work (TW). Right: comparison of MBH between TW and Paliya et al. (2021, P21) for 28 common sources. The dashed line represents the ideal one-to-one relation. |
3.4 Estimation of the Doppler factor
In the relativistic beaming model (Padovani & Urry 1990; Urry & Padovani 1995), the Doppler factor for a jet is given by δ = [Γ(1 − β cos θ)]−1, where θ is the viewing angle, β is the velocity in units of the speed of light, and Γ = (1 − β2)−1/2 is the bulk Lorentz factor. The origin of relativistic jets remains an open issue in AGN studies. Jets are believed to be launched near the central black hole, powered either by black hole spin (Blandford & Znajek 1977) or by accretion processes (Blandford & Payne 1982), which implies a link between accretion luminosity and jet power (Maraschi & Tavecchio 2003). Since both quantities are difficult to measure directly, their relationship is usually inferred through observable proxies (Celotti et al. 1997; Cao & Jiang 1999; Sbarrato et al. 2012; Ghisellini et al. 2014; Xiong & Zhang 2014; Zhang et al. 2020). The BLR luminosity, powered by disk photoionization (Kaspi et al. 2000, 2005; Bentz et al. 2009), is commonly adopted as a tracer of disk luminosity (Ldisk), while the γ-ray luminosity is used as a proxy for the jet bolometric luminosity  in γ-ray loud blazars (Ghisellini et al. 2014; Xiong & Zhang 2014; Zhang et al. 2020). Ghisellini et al. (2014) found a nearly linear relation, logPrad ~ 0.98logLdisk+0.639, where
  and f depends on the source type: f = 4/3 for BL Lacs and f = 16/5 for FSRQs. Because the viewing angle of blazars is very small, one can approximate sin(θ) ≈ 1/Γ, which leads to δ ≈ Γ. The radiative power of the jet can then be written as Ghisellini et al. (2014)
 (5)
(5)
Building on this relation, Zhang et al. (2020) separately considered the correlation between the radiant power and the accretion disk luminosity for BL Lacs and FSRQs using the ordinary and symmetrical least-squares regression (OLS4; Feigelson & Babu 1992). They then derived the Doppler factor estimation formula by setting Ldisk = 10LBLR and 
 (6)
(6)
for FSRQs, and
 (7)
(7)
for BL Lacs.
Thus, if both γ-ray and BLR luminosities are available, the Doppler factor of a blazar can be estimated. In this work, we applied this method to the 35 FSRQs and listed the results in Table 3. The derived Doppler factors span from δ = 3.62 for 4FGL J1319.5-0045 to 35.43 for 4FGL J2330.4+1230, with a mean value of ⟨δ⟩ = 13.41.
As discussed earlier, the Doppler factor is a crucial parameter for the relativistic jet, and yet it cannot be directly measured. A variety of approaches have been developed to estimate its value (Cheng et al. 1999; Fan et al. 1999, 2009, 2013, 2014; Fan 2005; Ghisellini et al. 1993, 2014; Chen 2018; Liodakis et al. 2018; Zhang et al. 2020; Ye & Fan 2021; Zhang et al. 2023; Chen et al. 2024). Ghisellini et al. (2014) derived Doppler factors from SED modeling and assumed δ ≃ Γ for blazars. They reported that the Doppler factor follows a relatively narrow distribution, peaking at δ = Γ ≈ 13 ± 1.4, based on a sample of 217 blazars. Chen (2018) estimated Doppler factors for 999 objects, including 461 FSRQs, where δ ranges from 6.6 to 50.4, with an average value of ⟨δ⟩ = 13.47. Liodakis et al. (2018) calculated variability Doppler factors for 878 sources (670 FSRQs, 118 BL Lacs, 33 radio galaxies, and 57 uncertain objects), and obtained a mean value of ⟨δ⟩ = 15.22 for the FSRQ subsample. Zhang et al. (2020) and Chen et al. (2024) estimated Doppler factors based on the correlation between jet radiative power and BLR luminosity, and found average values of ⟨δ⟩ = 13.18 for 274 FSRQs and ⟨δ⟩ = 15.74 for 595 FSRQs. Overall, the average Doppler factor derived in this work is consistent with the mean values reported in those previous studies.
4 Summary
In this work, we presented a comprehensive analysis of BCUs from the 4FGL-DR4 to advance their classification and physical characterization. Our main results are summarized as follows:
We obtained optical spectra for the candidate counterparts of 86 BCUs by cross-matching with SDSS-DR16. Based on detailed spectral analysis, we classified 35 sources as FSRQs, 45 as BL Lacs, 3 as LINERs, and 3 as regular elliptical galaxies, and secured redshifts for 54 objects. Notably, we identified and corrected an erroneous redshift in SDSS for 4FGL J1047.9+0055 (from z = 0.252 to z = 0.642). The distribution of our classified sources in the γ-ray luminosity versus photon index plane shows excellent consistency with firmly identified blazars, validating our classification scheme.
Furthermore, we estimated the MBH for the sample. For emission line objects, MBH was derived using virial methods based on the broad emission line properties, while for absorption-line dominated spectra, it was calculated from the stellar velocity dispersion of the host galaxy. The black hole masses span a range of log(MBH/M⊙) = 7.07–9.22.
For the 35 FSRQs in our sample, we estimated δ using an empirical relation that connects the γ-ray and broad-line region luminosities. The derived δ range from 3.62 to 35.43, with a mean value of ⟨δ⟩ = 13.41.
This study provides robust classifications, redshifts, and key physical parameters (MBH and δ) for a significant sample of previously uncertain γ-ray sources. These results not only substantially reduce the number of BCUs, but also provide a crucial foundation for future statistical studies of blazar populations, jet physics, and the connection between accretion processes and jet launching mechanisms.
Data availability
The full Tables 1–3 are available at the CDS via https://cdsarc.cds.unistra.fr/viz-bin/cat/J/A+A/707/A347 All figures for the entire sample are available on Zenodo at https://doi.org/10.5281/zenodo.18501299.
Acknowledgements
This research is partially supported by the National Natural Science Foundation of China (NSFC grants 12433004, 12133004 and 12303019), the National Key Research and Development Program of China (Grant No. 2025YFA1614102), the Eighteenth Regular Meeting Exchange Project of The Scientific and Technological Cooperation Committee between the People’s Republic of China and the Republic of Bulgaria (Series No. 1802), grants from the China Manned Space Project (Grant No. CMS-CSST-2025-A07). Additional support was provided for the Astrophysics Key Disciplines of Guangdong Province and Guangzhou City, as well as the Guangdong Major Project of Basic and Applied Basic Research (grant No. 2024A1515013169). This work is also supported by the Key Laboratory for Astronomical Observation and Technology of Guangzhou. W.X. Yang (No. 202309940006) and X.H. Ye (No. 202208440164) thank the support from the Chinese Scholarship Council.
References
- Abdo, A. A., Ackermann, M., Ajello, M., et al. 2009, Astropart. Phys., 32, 193 [Google Scholar]
- Abdo, A. A., Ackermann, M., Ajello, M., et al. 2010a, ApJS, 188, 405 [NASA ADS] [CrossRef] [Google Scholar]
- Abdo, A. A., Ackermann, M., Ajello, M., et al. 2010b, ApJ, 723, 1082 [Google Scholar]
- Abdollahi, S., Acero, F., Ackermann, M., et al. 2020, ApJS, 247, 33 [Google Scholar]
- Ahn, C. P., Alexandroff, R., Allende Prieto, C., et al. 2012, ApJS, 203, 21 [Google Scholar]
- Ahumada, R., Allende Prieto, C., Almeida, A., et al. 2020, ApJS, 249, 3 [NASA ADS] [CrossRef] [Google Scholar]
- Ajello, M., Angioni, R., Axelsson, M., et al. 2020, ApJ, 892, 105 [NASA ADS] [CrossRef] [Google Scholar]
- Aller, H. D., Aller, M. F., Plotkin, R. M., Hughes, P. A., & Hodge, P. E. 2003, in American Astronomical Society Meeting Abstracts, 203, 63.05 [Google Scholar]
- Álvarez Crespo, N., Masetti, N., Ricci, F., et al. 2016a, AJ, 151, 32 [CrossRef] [Google Scholar]
- Álvarez Crespo, N., Massaro, F., D’Abrusco, R., et al. 2016b, Ap&SS, 361, 316 [CrossRef] [Google Scholar]
- Álvarez Crespo, N., Massaro, F., Milisavljevic, D., et al. 2016c, AJ, 151, 95 [CrossRef] [Google Scholar]
- Álvarez Crespo, N., Domínguez, A., Paliya, V. S., et al. 2025, A&A, 694, A46 [NASA ADS] [CrossRef] [EDP Sciences] [Google Scholar]
- Andruchow, I., Romero, G. E., & Cellone, S. A. 2005, A&A, 442, 97 [NASA ADS] [CrossRef] [EDP Sciences] [Google Scholar]
- Atwood, W. B., Abdo, A. A., Ackermann, M., et al. 2009, ApJ, 697, 1071 [CrossRef] [Google Scholar]
- Baldwin, J. A., Phillips, M. M., & Terlevich, R. 1981, PASP, 93, 5 [Google Scholar]
- Ballet, J., Bruel, P., Burnett, T. H., Lott, B., & The Fermi-LAT collaboration 2023, arXiv e-prints [arXiv:2307.12546] [Google Scholar]
- Bentz, M. C., Walsh, J. L., Barth, A. J., et al. 2009, ApJ, 705, 199 [NASA ADS] [CrossRef] [Google Scholar]
- Blandford, R. D., & Payne, D. G. 1982, MNRAS, 199, 883 [CrossRef] [Google Scholar]
- Blandford, R. D., & Znajek, R. L. 1977, MNRAS, 179, 433 [NASA ADS] [CrossRef] [Google Scholar]
- Bolton, A. S., Schlegel, D. J., Aubourg, É., et al. 2012, AJ, 144, 144 [NASA ADS] [CrossRef] [Google Scholar]
- Boroson, T. A., & Green, R. F. 1992, ApJS, 80, 109 [Google Scholar]
- Cao, X., & Jiang, D. R. 1999, MNRAS, 307, 802 [NASA ADS] [CrossRef] [Google Scholar]
- Cappellari, M., & Emsellem, E. 2004, PASP, 116, 138 [Google Scholar]
- Cardelli, J. A., Clayton, G. C., & Mathis, J. S. 1989, ApJ, 345, 245 [Google Scholar]
- Celotti, A., Padovani, P., & Ghisellini, G. 1997, MNRAS, 286, 415 [NASA ADS] [CrossRef] [Google Scholar]
- Chen, L. 2018, ApJS, 235, 39 [NASA ADS] [CrossRef] [Google Scholar]
- Chen, G., Zheng, Z., Zeng, X., et al. 2024, ApJS, 271, 20 [Google Scholar]
- Chen, G., Yang, W., Liu, Y., et al. 2025, MNRAS, 544, 1926 [Google Scholar]
- Cheng, K. S., Fan, J. H., & Zhang, L. 1999, A&A, 352, 32 [NASA ADS] [Google Scholar]
- Chiaro, G., Salvetti, D., La Mura, G., et al. 2016, MNRAS, 462, 3180 [NASA ADS] [CrossRef] [Google Scholar]
- Cortes, C., & Vapnik, V. 1995, Mach. Learn., 20, 273 [Google Scholar]
- D’Ammando, F., Goldoni, P., Max-Moerbeck, W., et al. 2024, A&A, 683, A222 [NASA ADS] [CrossRef] [EDP Sciences] [Google Scholar]
- de Menezes, R., Peña-Herazo, H. A., Marchesini, E. J., et al. 2019, A&A, 630, A55 [NASA ADS] [CrossRef] [EDP Sciences] [Google Scholar]
- Fan, J. H. 2005, A&A, 436, 799 [NASA ADS] [CrossRef] [EDP Sciences] [Google Scholar]
- Fan, J. H., Cheng, K. S., Zhang, L., & Liu, C. H. 1997, A&A, 327, 947 [Google Scholar]
- Fan, J. H., Xie, G. Z., & Bacon, R. 1999, A&AS, 136, 13 [Google Scholar]
- Fan, J.-H., Huang, Y., He, T.-M., et al. 2009, PASJ, 61, 639 [Google Scholar]
- Fan, J.-H., Bastieri, D., Yang, J.-H., et al. 2014, Res. Astron. Astrophys., 14, 1135 [Google Scholar]
- Fan, J.-H., Yang, J.-H., Liu, Y., & Zhang, J.-Y. 2013, Res. Astron. Astrophys., 13, 259 [Google Scholar]
- Fan, J. H., Yang, J. H., Liu, Y., et al. 2016, ApJS, 226, 20 [CrossRef] [Google Scholar]
- Fan, J. H., Kurtanidze, S. O., Liu, Y., et al. 2021, ApJS, 253, 10 [Google Scholar]
- Feigelson, E. D., & Babu, G. J. 1992, ApJ, 397, 55 [NASA ADS] [CrossRef] [Google Scholar]
- Ferrarese, L., & Merritt, D. 2000, ApJ, 539, L9 [Google Scholar]
- Fisher, R. A. 1936, Ann. Eugenics, 7, 179 [CrossRef] [Google Scholar]
- Fu, Y. 2021, https://doi.org/10.5281/zenodo.4893734 [Google Scholar]
- García-Pérez, A., Peña-Herazo, H. A., Massaro, F., et al. 2023, AJ, 165, 127 [CrossRef] [Google Scholar]
- Ghisellini, G., Padovani, P., Celotti, A., & Maraschi, L. 1993, ApJ, 407, 65 [Google Scholar]
- Ghisellini, G., Maraschi, L., & Tavecchio, F. 2009, MNRAS, 396, L105 [NASA ADS] [Google Scholar]
- Ghisellini, G., Tavecchio, F., Maraschi, L., Celotti, A., & Sbarrato, T. 2014, Nature, 515, 376 [NASA ADS] [CrossRef] [Google Scholar]
- Goldoni, P., Pita, S., Boisson, C., et al. 2021, A&A, 650, A106 [NASA ADS] [CrossRef] [EDP Sciences] [Google Scholar]
- Gültekin, K., Richstone, D. O., Gebhardt, K., et al. 2009, ApJ, 698, 198 [Google Scholar]
- Guo, H., Shen, Y., & Wang, S. 2018, PyQSOFit: Python code to fit the spectrum of quasars, Astrophysics Source Code Library [record ascl:1809.008] [Google Scholar]
- Healey, S. E., Romani, R. W., Cotter, G., et al. 2008, ApJS, 175, 97 [Google Scholar]
- Jones, D. H., Read, M. A., Saunders, W., et al. 2009, MNRAS, 399, 683 [Google Scholar]
- Kasai, E., Goldoni, P., Pita, S., et al. 2023, MNRAS, 518, 2675 [Google Scholar]
- Kaspi, S., Smith, P. S., Netzer, H., et al. 2000, ApJ, 533, 631 [Google Scholar]
- Kaspi, S., Maoz, D., Netzer, H., et al. 2005, ApJ, 629, 61 [Google Scholar]
- Kewley, L. J., Dopita, M. A., Sutherland, R. S., Heisler, C. A., & Trevena, J. 2001, ApJ, 556, 121 [Google Scholar]
- Kewley, L. J., Groves, B., Kauffmann, G., & Heckman, T. 2006, MNRAS, 372, 961 [Google Scholar]
- Klindt, L., van Soelen, B., Meintjes, P. J., & Väisänen, P. 2017, MNRAS, 467, 2537 [Google Scholar]
- Kormendy, J., & Ho, L. C. 2013, ARA&A, 51, 511 [NASA ADS] [CrossRef] [Google Scholar]
- Lähteenmäki, A., & Valtaoja, E. 1999, ApJ, 521, 493 [Google Scholar]
- Landoni, M., Massaro, F., Paggi, A., et al. 2015, AJ, 149, 163 [Google Scholar]
- Liodakis, I., Marchili, N., Angelakis, E., et al. 2017, MNRAS, 466, 4625 [NASA ADS] [CrossRef] [Google Scholar]
- Liodakis, I., Hovatta, T., Huppenkothen, D., et al. 2018, ApJ, 866, 137 [Google Scholar]
- Marais, J. P., & van Soelen, B. 2024, MNRAS, 532, 4785 [Google Scholar]
- Maraschi, L., & Tavecchio, F. 2003, ApJ, 593, 667 [Google Scholar]
- Marcha, M. J. M., Browne, I.W. A., Impey, C. D., & Smith, P. S. 1996, MNRAS, 281, 425 [CrossRef] [Google Scholar]
- Marchesi, S., Kaur, A., & Ajello, M. 2018, AJ, 156, 212 [NASA ADS] [CrossRef] [Google Scholar]
- Massaro, F., Masetti, N., D’Abrusco, R., Paggi, A., & Funk, S. 2014, AJ, 148, 66 [NASA ADS] [CrossRef] [Google Scholar]
- Massaro, E., Maselli, A., Leto, C., et al. 2015a, Ap&SS, 357, 75 [Google Scholar]
- Massaro, F., D’Abrusco, R., Landoni, M., et al. 2015b, ApJS, 217, 2 [NASA ADS] [CrossRef] [Google Scholar]
- Massaro, F., Landoni, M., D’Abrusco, R., et al. 2015c, A&A, 575, A124 [NASA ADS] [CrossRef] [EDP Sciences] [Google Scholar]
- Massaro, F., Thompson, D. J., & Ferrara, E. C. 2015d, A&A Rev., 24, 2 [Google Scholar]
- Marchesini, E. J., Peña-Herazo, H. A., Álvarez Crespo, N., et al. 2019, Ap&SS, 364, 5 [NASA ADS] [CrossRef] [Google Scholar]
- Mattox, J. R., Bertsch, D. L., Chiang, J., et al. 1993, ApJ, 410, 609 [Google Scholar]
- McLure, R. J., & Dunlop, J. S. 2004, MNRAS, 352, 1390 [NASA ADS] [CrossRef] [Google Scholar]
- Moore, R. L., & Stockman, H. S. 1981, ApJ, 243, 60 [Google Scholar]
- Olmo-García, A., Paliya, V. S., Álvarez Crespo, N., et al. 2022, MNRAS, 516, 5702 [CrossRef] [Google Scholar]
- Padovani, P., & Urry, C. M. 1990, ApJ, 356, 75 [Google Scholar]
- Paggi, A., Milisavljevic, D., Masetti, N., et al. 2014, AJ, 147, 112 [NASA ADS] [CrossRef] [Google Scholar]
- Paiano, S., Falomo, R., Franceschini, A., Treves, A., & Scarpa, R. 2017a, ApJ, 851, 135 [NASA ADS] [CrossRef] [Google Scholar]
- Paiano, S., Landoni, M., Falomo, R., Treves, A., & Scarpa, R. 2017b, ApJ, 844, 120 [NASA ADS] [CrossRef] [Google Scholar]
- Paiano, S., Landoni, M., Falomo, R., et al. 2017c, ApJ, 837, 144 [Google Scholar]
- Paiano, S., Falomo, R., Treves, A., Franceschini, A., & Scarpa, R. 2019, ApJ, 871, 162 [NASA ADS] [CrossRef] [Google Scholar]
- Paliya, V. S. 2022, J. Astrophys. Astron., 43, 15 [Google Scholar]
- Paliya, V. S., Domínguez, A., Ajello, M., Olmo-García, A., & Hartmann, D. 2021, ApJS, 253, 46 [NASA ADS] [CrossRef] [Google Scholar]
- Peña-Herazo, H. A., Marchesini, E. J., Álvarez Crespo, N., et al. 2017, Ap&SS, 362, 228 [CrossRef] [Google Scholar]
- Peña-Herazo, H. A., Amaya-Almazán, R. A., Massaro, F., et al. 2020, A&A, 643, A103 [NASA ADS] [CrossRef] [EDP Sciences] [Google Scholar]
- Peña-Herazo, H. A., Massaro, F., Gu, M., et al. 2021a, AJ, 162, 76 [Google Scholar]
- Peña-Herazo, H. A., Paggi, A., García-Pérez, A., et al. 2021b, AJ, 162, 177 [CrossRef] [Google Scholar]
- Pei, Z., Fan, J., Yang, J., Huang, D., & Li, Z. 2022, ApJ, 925, 97 [NASA ADS] [CrossRef] [Google Scholar]
- Rajput, B., Goldoni, P., Max-Moerbeck, W., et al. 2025, A&A, 704, A190 [NASA ADS] [CrossRef] [EDP Sciences] [Google Scholar]
- Ricci, F., Massaro, F., Landoni, M., et al. 2015, AJ, 149, 160 [Google Scholar]
- Romero, G. E., Cellone, S. A., & Combi, J. A. 2000, A&A, 360, L47 [NASA ADS] [Google Scholar]
- Sahakyan, N., Vardanyan, V., & Khachatryan, M. 2023, MNRAS, 519, 3000 [Google Scholar]
- Sbarrato, T., Ghisellini, G., Maraschi, L., & Colpi, M. 2012, MNRAS, 421, 1764 [Google Scholar]
- Schlegel, D. J., Finkbeiner, D. P., & Davis, M. 1998, ApJ, 500, 525 [Google Scholar]
- Shaw, M. S., Romani, R. W., Healey, S. E., et al. 2009, ApJ, 704, 477 [NASA ADS] [CrossRef] [Google Scholar]
- Shaw, M. S., Filippenko, A. V., Romani, R. W., Cenko, S. B., & Li, W. 2013a, AJ, 146, 127 [NASA ADS] [CrossRef] [Google Scholar]
- Shaw, M. S., Romani, R. W., Cotter, G., et al. 2013b, ApJ, 764, 135 [NASA ADS] [CrossRef] [Google Scholar]
- Shen, Y., Hall, P. B., Horne, K., et al. 2019, ApJS, 241, 34 [NASA ADS] [CrossRef] [Google Scholar]
- Shen, Y., Richards, G. T., Strauss, M. A., et al. 2011, ApJS, 194, 45 [Google Scholar]
- Stickel, M., Padovani, P., Urry, C. M., Fried, J. W., & Kuehr, H. 1991, ApJ, 374, 431 [Google Scholar]
- Urry, C. M., & Padovani, P. 1995, PASP, 107, 803 [NASA ADS] [CrossRef] [Google Scholar]
- Vazdekis, A., Sánchez-Blázquez, P., Falcón-Barroso, J., et al. 2010, MNRAS, 404, 1639 [NASA ADS] [Google Scholar]
- Vestergaard, M., & Peterson, B. M. 2006, ApJ, 641, 689 [Google Scholar]
- Vestergaard, M., & Wilkes, B. J. 2001, ApJS, 134, 1 [Google Scholar]
- von Montigny, C., Bertsch, D. L., Chiang, J., et al. 1995, ApJ, 440, 525 [Google Scholar]
- Wills, B. J., Wills, D., Breger, M., Antonucci, R. R. J., & Barvainis, R. 1992, ApJ, 398, 454 [NASA ADS] [CrossRef] [Google Scholar]
- Xiong, D. R., & Zhang, X. 2014, MNRAS, 441, 3375 [NASA ADS] [CrossRef] [Google Scholar]
- Xiao, H. B., Zhu, J. T., Fan, J. H., et al. 2022, MNRAS, 517, 4202 [Google Scholar]
- Yang, W. X., Wang, H. G., Liu, Y., et al. 2022a, ApJ, 925, 120 [Google Scholar]
- Yang, W.-X., Xiao, H.-B., Wang, H.-G., et al. 2022b, Res. Astron. Astrophys., 22, 085002 [Google Scholar]
- Yang, J.-H., Fan, J.-H., Yang, W.-X., et al. 2026, Sci. Sin. Phys. Mech. Astron., 56, 269811 [Google Scholar]
- Ye, X.-H., & Fan, J.-H. 2021, PASJ, 73, 775 [Google Scholar]
- Yip, C. W., Connolly, A. J., Szalay, A. S., et al. 2004a, AJ, 128, 585 [Google Scholar]
- Yip, C. W., Connolly, A. J., Vanden Berk, D. E., et al. 2004b, AJ, 128, 2603 [Google Scholar]
- Zhang, L., Chen, S., Xiao, H., Cai, J., & Fan, J. 2020, ApJ, 897, 10 [Google Scholar]
- Zhang, L., Yang, J., Liu, Y., & Fan, J. 2023, Sci. China Phys. Mech. Astron., 66, 109511 [Google Scholar]
- Zheng, Y. G., & Zhang, L. 2011, ApJ, 728, 105 [Google Scholar]
- Zheng, Y. G., Kang, S. J., & Li, J. 2014, MNRAS, 442, 3166 [Google Scholar]
Appendix A Classification and identified lines of 86 optical spectra
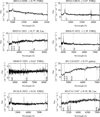 |
Fig. A.1 SDSS optical spectra of eight Fermi BCUs with identified lines. Each subplot title corresponds to the 4FGL name, redshift, and classification based on observed spectral lines. (All figures for the entire sample are available on Zenodo.) |
All Tables
All Figures
|
Fig. 1 Left: comparison between the redshift reported in the SDSS catalog and those determined in this work based on emission or absorption lines. The dashed line represents y = x. Right: spectrum of BCU source 4FGL J1047.9+0055, whose redshift is reported as z = 0.252 in SDSS-DR16. However, based on the detection of multiple emission lines, its correct redshift is z = 0.642. |
| In the text | |
|
Fig. 2 SDSS optical spectrum of 4FGL J2148.9-0121 (black) is shown alongside the results of the stellar population synthesis performed with pPXF (red). The bottom panel displays the residuals of the fit. Wave-length regions excluded from the fit to avoid emission lines are marked by the gray-shaded columns. |
| In the text | |
|
Fig. 3 (a) SDSS optical spectrum of 4FGL J0943.7+6137, a source classified as a FSRQs, showing a quasar-like spectrum along with labels of some emission lines. (b) Optical spectrum of 4FGL J1223.0+1100, a classical BL Lac object, showing the almost featureless blue spectrum; (c) SDSS optical spectrum of 4FGL J1614.4+5028, which shows absorption and emission lines from the host galaxy. |
| In the text | |
|
Fig. 4 Optical spectra of 4FGL J1614.4+5028 (a) and 4FGL J1046.0+5448 (b) modeled with QSOFITMORE. The spectral data are shown with the black line. The red and green lines represent broad and narrow components of the emission line, and the modeled continuum is plotted with the orange line. The blue line is the sum of all the components. The purple line represents the host galaxy component. The horizontal gray dashes at the top of the plots denote the line-free wavelength regions selected to model the continuum emission. It is noteworthy that both spectra are dominated by absorption lines. However, in (a), after subtracting the host galaxy component, the Hα line only has a narrow component, thus is classified as a BL Lac. In contrast, in (b), after subtracting the host galaxy component, the Hα line still exhibits a prominent broad component, and is classified as a FSRQ. Both spectra are from SDSS-DR16. |
| In the text | |
|
Fig. 5 γ-ray luminosity and photon index plane for confirmed blazars from the Fermi/LAT catalog and for the classifications of 117 BCUs from our work. The straight lines indicate the boundaries between FSRQs and BL Lacs: αph = −0.127 logLγ + 8.18 (purple dashed) is from Chen (2018), αph = −0.140 logLγ + 8.73 (purple solid) for SVM, and αph = −0.153 logLγ + 9.26 (blue solid) for LDA. |
| In the text | |
|
Fig. 6 Left: distribution of black hole masses (MBH) for sources with emission line (green) and absorption line (blue) dominated spectra in this work (TW). Right: comparison of MBH between TW and Paliya et al. (2021, P21) for 28 common sources. The dashed line represents the ideal one-to-one relation. |
| In the text | |
|
Fig. A.1 SDSS optical spectra of eight Fermi BCUs with identified lines. Each subplot title corresponds to the 4FGL name, redshift, and classification based on observed spectral lines. (All figures for the entire sample are available on Zenodo.) |
| In the text | |
Current usage metrics show cumulative count of Article Views (full-text article views including HTML views, PDF and ePub downloads, according to the available data) and Abstracts Views on Vision4Press platform.
Data correspond to usage on the plateform after 2015. The current usage metrics is available 48-96 hours after online publication and is updated daily on week days.
Initial download of the metrics may take a while.