Fig. 4
Download original image
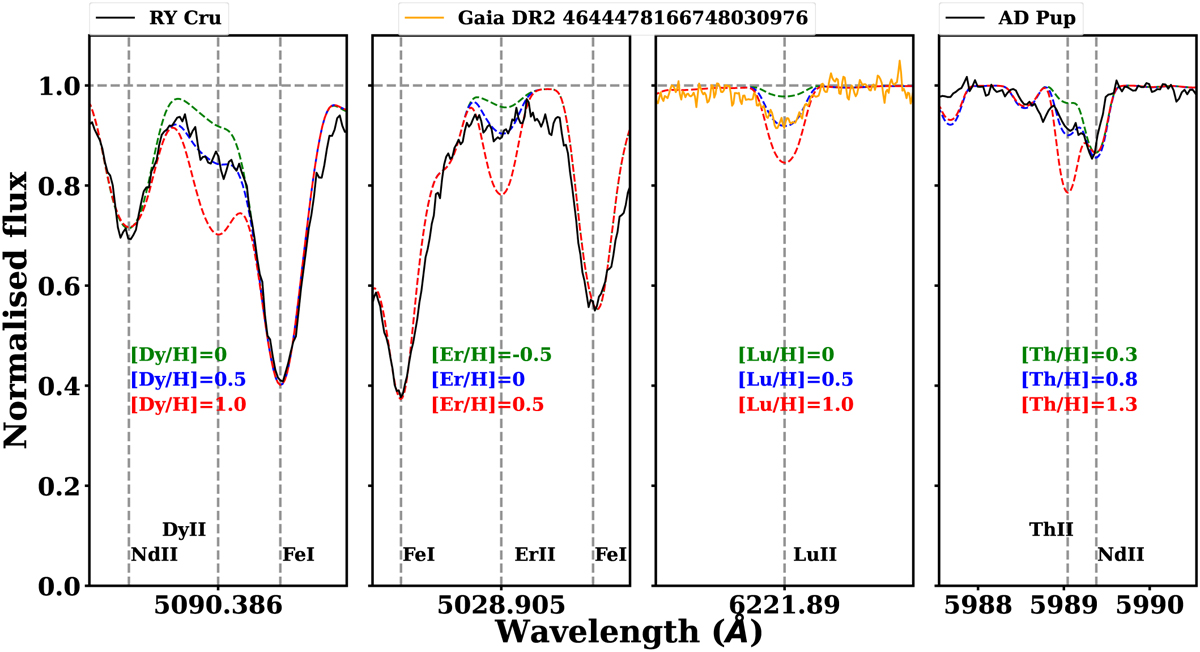
Observed spectrum of RY Cru (solid black line, left and centre panel) and Gaia DR2 4644478166748030976 (solid orange line, right panel) in the region of DyII (5090.386 Å, left panel), ErII (5028.905 Å, centre panel) and LuII (6221.89 Å, right panel) spectral lines. The position of these and other visible lines is reported and highlighted with vertical dashed grey lines. Synthetic spectra computed for the best estimated abundance are reported in blue, while the same spectra with [X/H]=±0.5 dex are plotted in red and green, respectively.
Current usage metrics show cumulative count of Article Views (full-text article views including HTML views, PDF and ePub downloads, according to the available data) and Abstracts Views on Vision4Press platform.
Data correspond to usage on the plateform after 2015. The current usage metrics is available 48-96 hours after online publication and is updated daily on week days.
Initial download of the metrics may take a while.