Fig. 8
Download original image
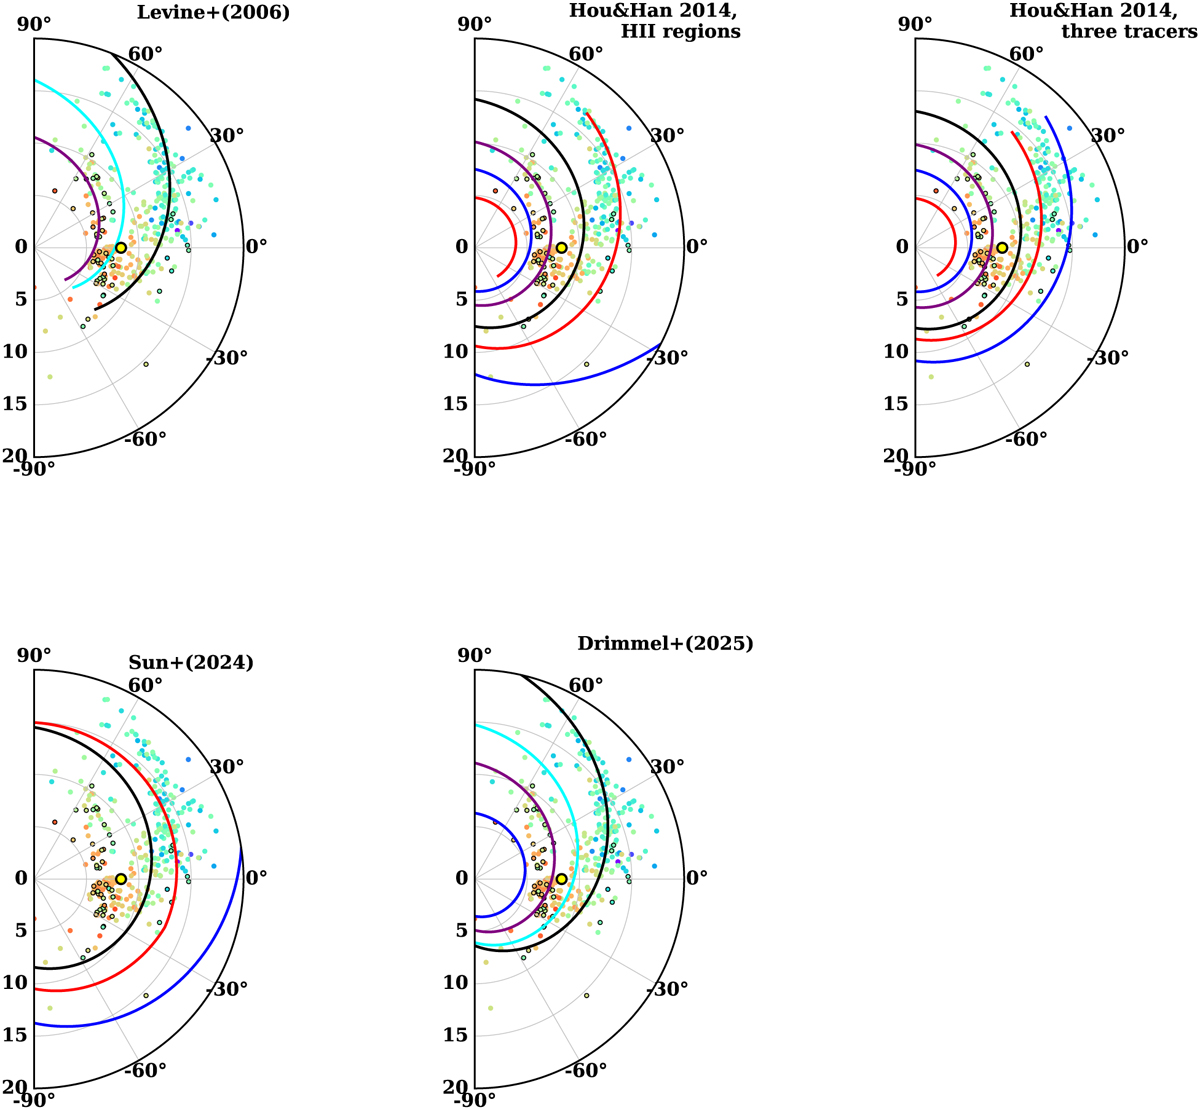
Spiral arm models from Levine et al. (2006) (HI regions), Hou & Han (2014) (using only HII regions or three different tracers), Sun et al. (2024) (CO regions), and Drimmel et al. (2025) (DCEPs) are superimposed on our targets in the top left, top middle, top right, bottom left and bottom middle panels, respectively. All the models (with the exception of Sun et al. 2024) are collected in the Python SpiralMap package (Prusty & Khanna 2025). Spiral arm colours are the same as those in Fig. 7.
Current usage metrics show cumulative count of Article Views (full-text article views including HTML views, PDF and ePub downloads, according to the available data) and Abstracts Views on Vision4Press platform.
Data correspond to usage on the plateform after 2015. The current usage metrics is available 48-96 hours after online publication and is updated daily on week days.
Initial download of the metrics may take a while.