Fig. 1.
Download original image
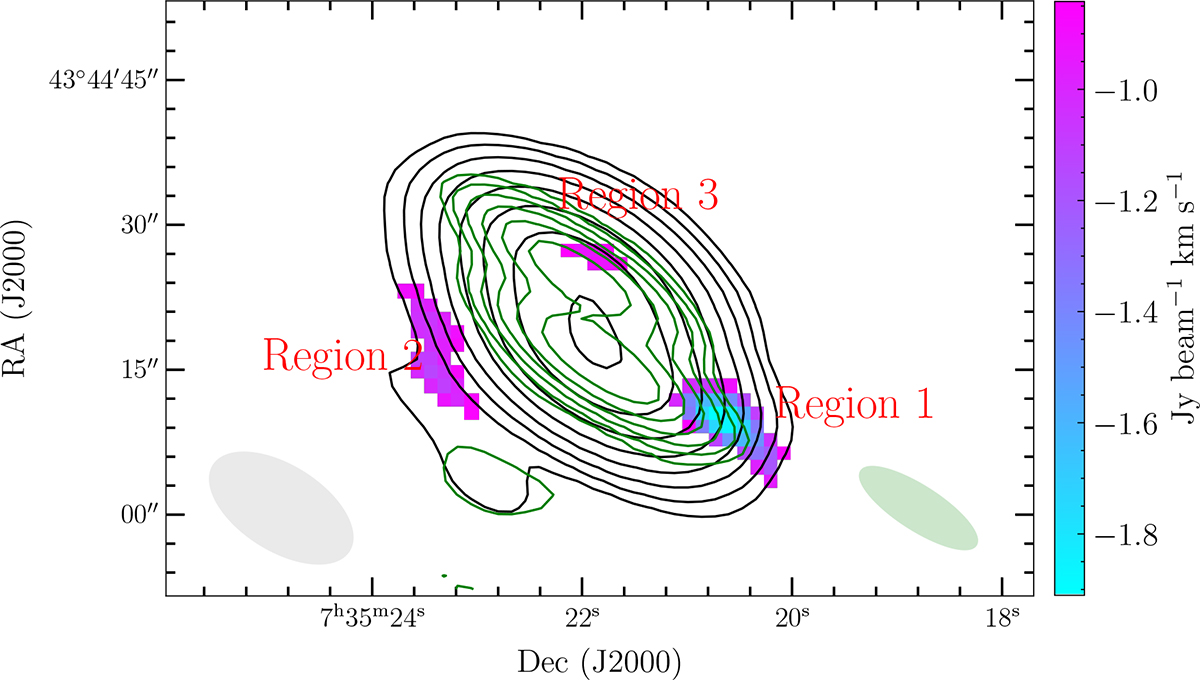
Continuum images and H I absorption moment 0 map. The black contours represent the image with natural weighting, which start at 3σ noise and increase by a factor of 2, while the green contours show the image with uniform weighting, which start at 3σ noise and increase by a factor of 2. The color image is the H I absorption moment 0 map with natural weighting. Only pixels with absorption stronger than 1.5σ are shown, where σ is the noise of the map. The right color bar shows the depth of the absorption. The map contains three unresolved regions, compared to the beam size. H I absorption lines were extracted from the peak absorption pixels of the three regions, which are presented in Fig. 2.
Current usage metrics show cumulative count of Article Views (full-text article views including HTML views, PDF and ePub downloads, according to the available data) and Abstracts Views on Vision4Press platform.
Data correspond to usage on the plateform after 2015. The current usage metrics is available 48-96 hours after online publication and is updated daily on week days.
Initial download of the metrics may take a while.