| Issue |
A&A
Volume 707, March 2026
|
|
|---|---|---|
| Article Number | A43 | |
| Number of page(s) | 7 | |
| Section | Extragalactic astronomy | |
| DOI | https://doi.org/10.1051/0004-6361/202557997 | |
| Published online | 25 February 2026 | |
A jet-gas interaction beyond the host galaxy: Detection of a neutral hydrogen outflow at cosmic noon
1
Shanghai Astronomical Observatory, Chinese Academy of Sciences 80 Nandan Road Shanghai 200030, China
2
School of Chemical and Physical Sciences, Victoria University of Wellington PO Box 600 Wellington 6140, New Zealand
3
First Light Fusion Ltd., Unit 9/10 Oxford Pioneer Park Mead Road Yarnton Kidlington OX5 1QU, UK
4
Institute for Astronomy, University of Edinburgh, Royal Observatory Edinburgh EH9 3HJ, UK
5
Inter-University Institute for Data Intensive Astronomy, Department of Astronomy, University of Cape Town Cape Town, South Africa
6
International Centre for Radio Astronomy Research (ICRAR), Curtin University Bentley WA, Australia
7
ATNF, CSIRO Space and Astronomy PO Box 76 Epping NSW 1710, Australia
8
State Key Laboratory of Radio Astronomy and Technology, A20 Datun Road Chaoyang District Beijing 100101, PR China
9
College of Physics, Guizhou University 550025 Guiyang, PR China
10
National Astronomical Observatories, Chinese Academy of Sciences 20A Datun Road Beijing 100101, China
★ Corresponding authors: This email address is being protected from spambots. You need JavaScript enabled to view it.
; This email address is being protected from spambots. You need JavaScript enabled to view it.
Received:
6
November
2025
Accepted:
18
January
2026
Abstract
We present upgraded Giant Metrewave Radio Telescope (uGMRT) observations of 0731+438, an FR II radio galaxy at a redshift of 2.429 with two lobes separated by 82 kpc. A blueshifted, faint, and broad H I 21 cm absorption line with a velocity full width at half maximum of ∼ 600 km s−1 is detected against the southern radio lobe that is 47 kpc from radio core, indicating a neutral hydrogen outflow associated with jet-gas interaction beyond the host galaxy. The outflow has a mass outflow rate of ∼0.4TsΩ M⊙ yr−1, which could increase to ∼ 4.0TsΩ M⊙ yr−1, corresponding to an energy outflow rate of 2.4TsΩ × 1040–1.5Ts Ω × 1041 erg s−1, where Ts is the spin temperature and Ω is the solid angle of the outflow. Previous optical observations identified an extended emission line region aligned with the radio axis, ionized by the central active galactic nucleus (AGN). Within this region, a warm and ionized outflow with a mass outflow rate of ∼50 M⊙ yr−1 and an energy outflow rate of ∼ 1.7 × 1043 erg s−1 was detected. We propose that both the extended emission line region and the optical outflow are results of a synergistic effect between the jet and AGN radiation. The AGN likely exerts negative feedback on the host galaxy, as is evidenced by the gas expulsion by the jet and the high-velocity dispersion of ionized gas observed optically. So far, detections of jet-driven neutral hydrogen outflows remain rare. The high redshift, large outflow radii, substantial mass outflow rate, and energy outflow rate of the neutral hydrogen outflow in 0731+438 expand the known parameter space of such outflows. Finally, we find tentative correlations between the neutral hydrogen mass outflow rate (or energy outflow rate) and the rest-frame 1.4 GHz radio power of jets for the known broad neutral hydrogen outflows.
Key words: ISM: jets and outflows / galaxies: active / galaxies: ISM / galaxies: jets
© The Authors 2026
 Open Access article, published by EDP Sciences, under the terms of the Creative Commons Attribution License (https://creativecommons.org/licenses/by/4.0), which permits unrestricted use, distribution, and reproduction in any medium, provided the original work is properly cited.
This article is published in open access under the Subscribe to Open model. This email address is being protected from spambots. You need JavaScript enabled to view it. to support open access publication.
1. Introduction
H I, as the most abundant element in the Universe, plays a fundamental role in galaxy evolution by supplying fuel for star formation. Extensive research has demonstrated its critical involvement in black hole accretion and feedback (e.g. Morganti & Oosterloo 2018). H I absorption, whereby the foreground neutral hydrogen absorbs the background radio emission at a rest frame wavelength of ∼21 cm, serves as a powerful diagnostic tool for investigating neutral gas distribution in and around galaxies (e.g. Allison et al. 2012; Maccagni et al. 2017; Aditya & Kanekar 2018a; Gupta et al. 2021a; Allison et al. 2022; Su et al. 2022; Chandola et al. 2024; Hu et al. 2025; Yoon et al. 2025). Usually, symmetric H I absorption profiles centered on the systemic velocity of host galaxies1 regularly trace a rotating disk, while asymmetric and broad H I absorption lines reveal outflows driven by jets (e.g. Morganti et al. 2005; Morganti & Oosterloo 2018). Studies have demonstrated that observing H I absorption in bright radio galaxies is an effective method of understanding the gas kinematics and dynamics in jet-gas interaction and further the feedback by jets (e.g. Mahony et al. 2013; Morganti et al. 2013; Su et al. 2023a,b).
Jets can exert powerful feedback on host galaxies (e.g. Wagner & Bicknell 2011; Wagner et al. 2012; Mukherjee et al. 2018). As jets develop, they would interact with surrounding interstellar gas, transferring substantial energy that modifies gas kinematics and structure, ultimately regulating star formation activity. A famous example is 4C 12.50 in which, through H I absorption observations, a cloud of neutral hydrogen gas was found to be expelled outward by the radio jet, possibly inducing negative feedback (Morganti et al. 2013). More importantly, jets can restart for many times throughout the lifetime of a galaxy, implying that jet-driven feedback can repeatedly occur, and hence have a profound impact on the host galaxies, altering their evolution trajectory. However, observations and analysis of jet-gas interaction are not sufficient (Mukherjee 2025); an adequate picture of jet-gas interaction and its feedback often involves multiwavelength observations of multiphase gas. To date, the detections of jet-driven neutral hydrogen outflows are scarce, mainly are at low redshift and at parsec or kiloparsec scales (Morganti & Oosterloo 2018; Mukherjee 2025), limiting our knowledge.
Here, we report a particular case of jet-driven outflow at z = 2.429. 0731+438 is a type 2 quasar (Derry et al. 2003), exhibiting FR II radio morphology with two lobes and a core (Carilli et al. 1997; Morabito et al. 2016; Sweijen et al. 2022; Cordun et al. 2023). The radio emission extends to 9.9 arcsec, corresponding to a projected linear distance of 82 kpc (Sweijen et al. 2022). Subaru observations reveal biconical lobes of Hα+[N II] emission lines with an extent of 40 kpc that aligned with the radio axis (Motohara et al. 2000), supporting the existence of jet-gas interaction. Previous Westerbork Synthesis Radio Telescope (WSRT) observations indicate a possible faint H I absorption line (Röttgering et al. 1999). However, the spectrum was severely affected by radio frequency interference (RFI) and was not presented. We therefore proposed upgraded Giant Metrewave Radio Telescope (uGMRT) observations to: 1) test whether the H I absorption is real; 2) study the neutral hydrogen gas in the jet-gas interaction.
We organize the paper as follows. We present the observations and data reduction in Sect. 2 and the observational results in Sect. 3. Discussions and a summary are in Sects. 4 and 5, respectively.
2. Observation and data reduction
We conducted the uGMRT observations on January 20, 2023. A bandwidth of 25 MHz centered on 414.3 MHz and divided into 2048 channels was used, which provided a velocity coverage of −9000–9000 km s−1 and a velocity resolution of ∼8.8 km s−1. 3C 147 was used for bandpass and flux calibrator. Our target 0731+438 was observed for three scans of 38 minutes each embraced by scans of a gain calibrator, 0702+445.
The data were calibrated and imaged using CASA (CASA Team 2022). Before calibrating, we first inspected the raw visibilities and removed bad data from shadowing, the beginning and end of each scan, non-working antennas, and RFI. We then performed the following calibration steps: an initial flux density scaling, bandpass calibration, complex gain calibration, scaling the amplitude of the complex gain calibrator, and applying the solutions. Next we further inspected the data and flagged outliers. The above calibration-flagging process was repeated using the flagging table produced in the previous iteration to refine the data. Absorption was clearly visible in the calibrated visibilities over 413.610–414.831 MHz, which corresponds to z = 2.424–2.434.
Finally, we split our target visibilities. To image the continuum, we excluded the line channels and binned the visibilities to a coarse resolution of 244 kHz. We made the continuum image with the task tclean. Two iterations of phase-only self-calibrations and one iteration of amplitude-and-phase self-calibration were applied to improve the image quality. To make the spectral cube, we first applied the self-calibration solutions to the original calibrated high-frequency resolution visibilities, then we fit a second-order polynomial in the frequency ranges of 412.390–413.610 MHz and 414.831–416.052 MHz in the visibility domain to subtract the continuum. We next inspected the spectral baselines and flagged those with inadequate continuum subtraction. Finally, we generated the cube using the channels between 412.390 and 416.052 MHz. Since we flagged more baselines when making the cube, we remade the continuum image with the same baselines, which guarantees the same UV coverage for the continuum image and the spectral cube.
3. Results
3.1. Continuum images
Figure 1 shows the continuum images. The image with natural weighting has a beam size of 16.5 arcsec × 8.7 arcsec with a position angle (PA) of 57.7°, a peak flux density of 1.67 ± 0.08 Jy beam−1, an integral flux of 2.7 ± 0.1 Jy, and a root mean square (rms) noise of 4.0 mJy beam−1. The image with uniform weighting has a beam size of 14.1 arcsec × 4.5 arcsec with a PA of 57.2°, a peak flux density of 1.27 ± 0.06 Jy beam−1, an integral flux of 2.6 ± 0.1 Jy, and a rms noise of 5.0 mJy beam−1. Note that the associated uncertainties were derived by assuming the flux calibrator has a flux uncertainty at the 5% level. Two components are clearly seen in the uniform weighting image, corresponding to the two radio lobes disclosed in other higher-spatial-resolution images (Carilli et al. 1997; Morabito et al. 2016; Sweijen et al. 2022; Cordun et al. 2023). The southern lobe is about 47 kpc from the core, while the northern lobe is about 36 kpc from the core (Sweijen et al. 2022).
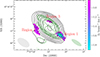 |
Fig. 1. Continuum images and H I absorption moment 0 map. The black contours represent the image with natural weighting, which start at 3σ noise and increase by a factor of 2, while the green contours show the image with uniform weighting, which start at 3σ noise and increase by a factor of 2. The color image is the H I absorption moment 0 map with natural weighting. Only pixels with absorption stronger than 1.5σ are shown, where σ is the noise of the map. The right color bar shows the depth of the absorption. The map contains three unresolved regions, compared to the beam size. H I absorption lines were extracted from the peak absorption pixels of the three regions, which are presented in Fig. 2. |
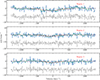 |
Fig. 2. H I absorption lines extracted from the peak absorption pixels of the three regions in Fig. 1.The blue lines are observed spectra, the green lines are observed spectra resampled to a velocity resolution of 50 km s−1 using SpecRes (Carnall 2017), the red lines are fit Gaussian components, and the gray lines are residuals. |
3.2. Spectral results
We generated the spectral cube with natural weighting, which has an rms noise of 2.16 mJy beam−1 with a velocity resolution of ∼8.8 km s−1. To pinpoint the location of the absorption, we made the moment 0 map; see Fig. 1. In the map we see three distinct regions where the absorption exceeds 1.5σ, where σ is the rms noise of the moment 0 map. Given the beam size, these regions are not resolved and so we extracted spectra from the peak absorption pixels of the regions. The spectra are presented in Fig. 2.
All spectra are well fit by a single Gaussian function. The fit parameters are listed in Table 1. The entire line 1 has a significance of ∼10σ, whereas lines 2 and 3 have lower significances of ∼5σ and ∼4σ throughout their entirety. For the sake of conservation, we take lines 2 and 3 to be possible detections. Furthermore, the H I column density calculated from the line 3 is much lower than those of line 1 and line 2, indicating negligible influence, we so exclude the line 3 in the analysis. However, line 2 exhibits the highest column density, which is retained as a limit in the analysis.
Line parameters.
4. Discussion
4.1. The detection of HI absorption at high redshift
It is well known that the H I absorption detection rate is lower at higher redshift (e.g. Curran et al. 2008; Aditya & Kanekar 2018b; Su et al. 2022; Curran 2024). Despite extensive searches (e.g. Curran et al. 2008, 2016, 2017; Grasha et al. 2019; Gupta et al. 2021b), the number of associated H I absorption detections at z > 2 is just five, which are B2 0902+345 at z = 3.397 (Uson et al. 1991), MG J0414+0534 at z = 2.6365 (Moore et al. 1999), 8C 0604+728 at z = 3.523 (Aditya et al. 2021), M1540-1453 at z = 2.114 (Gupta et al. 2021b, 2022), and NVSS J164725+375218 at z = 2.327 (CHIME Collaboration 2025). Our detection toward 0731+438 at z = 2.429 is the sixth at z > 2.
The low detection was attributed to the reliance upon on optical redshift biasing toward the most UV luminous objects at high redshift (Curran et al. 2008). Curran & Whiting (2012) subsequently showed that the critical luminosity above which H I was not detected, L1216 Å > 1023 W Hz−1 or an ionizing photon rate of Q ∼ 1056 s−1 (Curran et al. 2017), was just sufficient to ionize all the neutral gas in a large spiral galaxy. Most recently, Curran (2024) has shown an anticorrelation between the H I absorption strength and the ionizing photon rate. Using Keck spectroscopic observations, Vernet et al. (2001) measured a monochromatic luminosity of 6.3 × 1041 erg s−1 Å−1 at rest frame wavelength λrest = 1500 Å and a continuum slope of β = −1.43 (Fλ ∝ λβ) between 1500 Å and 2000 Å. Extrapolating the slope to 1216 Å, we obtained a UV luminosity of L1216 Å = 4.2 × 10²² W Hz−1, which is below the critical value of 1023 W Hz−1. This seems to explain why we can detect H I absorption in 0731+438. However, as the observed UV luminosity has not been corrected for absorption from the host galaxy, the detailed situation is complicated.
Subaru narrow-band observations of Hα+[NII] disclosed biconical lobes with an extent of 40 kpc aligned with the radio axis (Motohara et al. 2000). Analysis suggested that the Hα emission come from nebula ionized by the strong isotropic UV radiation of the central active galactic nucleus (AGN). The ionizing photon rate required to produce the observed Hα luminosity is at least 1.4 × 1057 s−1, which is much larger than the critical value of ∼ 1056 s−1 (Curran et al. 2017). It seems that the observation is in conflict with theory.
It is worth noting that the radio source displays an FR II morphology, with a linear size of 82 kpc (Sweijen et al. 2022), and that the H I absorption takes place outside the host galaxy (see Sect. 4.2). While an ionizing photon rate of Q ∼ 1056 s−1 might be sufficient to ionize the neutral gas within the host galaxy, it would be insufficient to ionize the neutral gas in the halo or circumgalactic medium (CGM).
The detection of H I absorption in 0731+438 may inform us on the future observational strategy for H I absorption at high redshift (z > 2). Previous searches for H I absorption are biased to compact radio sources, which are still confined in host galaxies, and hence exhibit a higher detection rate compared to extended radio sources (e.g. Curran et al. 2013; Maccagni et al. 2017). While it is a good criterion to search for H I absorption at low redshift, it may not be ideal for sources at high redshift due to the preselection of sources with a high rest-frame UV luminosity that could ionize the neutral gas in host galaxies (e.g. Curran et al. 2008; Aditya et al. 2016; Curran et al. 2017; Aditya & Kanekar 2018a; Grasha et al. 2019). We suggest that selecting extended radio sources, such as FR I and FR II types, rather than compact radio sources for searches of high-redshift-associated H I absorption might be more efficient, aiming to probe the neutral gas in halo or CGM rather than in host galaxies. More observations of extended radio sources at high redshift will test this hypothesis.
4.2. The role of the neutral gas
Usually, symmetric H I absorption profiles centered on the systemic velocity of host galaxies trace regularly rotating disks, while asymmetric and broad H I absorption lines reveal outflows driven by jets (e.g. Morganti et al. 2005; Morganti & Oosterloo 2018). The gas detected in 0731+438 has two outstanding properties that can help us to know what role they are playing. The first is the location of the gas. As is seen in Fig. 1, lines 1 and 2 are associated with the southern radio lobe and at its edge, while line 3 is associated with the northern radio lobe. Both lobes have extended out of the host galaxy, indicating that the detected gas is not from any rotating disk in the host galaxy. The second is the large velocity width. Line 1 has a large velocity span with a full width at half maximum (FWHM) of ∼600 km s−1. This resembles the kinematics of the outflowing gas driven by the jet that has been detected in, for example, 4C 12.50, 3C 293, and IRAS 10565+2448 (Morganti et al. 2013; Mahony et al. 2013; Su et al. 2023b). These two properties unambiguously point out that the lines we observed are tracing jet-driven outflows.
To obtain the H I mass outflow rate, we followed the equation (Heckman 2002)
 (1)
(1)
where the Ω is the solid angle of outflow, r* is the outflow radius, NHI is the H I column density, and v is the outflow velocity.
Lines 1 and 2 are associated with the southern jet. Based on the fit line parameters and the continuum flux density of the pixels from where we extracted the lines, we calculated the peak and integrated optical depth, which are listed in Table 1. The H I column density is dependent on spin temperature, Ts. Line 1 suggests a column density of (1.5 ± 0.3) × 1019Ts cm−2, while line 2 suggests a column density one order of magnitude higher. As a compromise, when we estimated the mass outflow rate, we used the column density calculated from line 1 as a lower limit and the column density calculated from line 2 as an upper limit. The southern jet is at a distance of about 47 kpc from the core, which is the outflow radii. The velocity, v, was determined from the line fit. Therefore, Ṁ = 0.387 TsΩ M⊙ yr−1 (using line 1), which could increase to 3.925TsΩ M⊙ yr−1 (using line 2). We show the distribution of Ṁ as a function of Ts and Ω in Fig. 3. Assuming that Ts = 100 K and Ω = π/2 for the outflow, the mass outflow rate spans between ∼60.8 M⊙ yr−1 and ∼616.3 M⊙ yr−1.
 |
Fig. 3. Distributions of H I column density, mass outflow rate, and energy outflow rate as a function of Ω and Tspin/f for lines 1 and 2, where Ω is the solid angle of the outflow and Tspin/f is the spin temperature divided by the covering factor. Note that the column density limits are constrained by Tspin/f > Tcmb at z = 2.4 and NHI < 3 × 10²² (Schaye 2001; Curran 2024), where Tcmb is the temperature of the cosmic microwave background. |
To understand the impact of the outflow, it is crucial to know the kinetic power of the outflow. We used
 (2)
(2)
which accounts for the turbulence (Holt et al. 2006), giving Ė = 2.4Ts Ω × 1040–1.5TsΩ × 1041 erg s−1. We show the distribution of Ṁ as a function of Ts and Ω in Fig. 3. Analogously, assuming Ts = 100 K and Ω = π/2, the Ė is at somewhere between 3.8 × 1042 and 2.4 × 1043 erg s−1.
4.3. The jet-gas interaction at other wavelengths in 0731+438
Multiwavelength observations can yield information from multiphase gas. While radio observations provide the information about cold neutral hydrogen gas, optical observations can inform us about the warm ionized gas. The Subaru observations found biconical lobes with an extent of 40 kpc aligned with the radio axis, supporting the existence of jet-gas interaction. Furthermore, Keck spectroscopic observations detected a longer extent of Ly α emission along with the radio axis (Villar-Martín et al. 2003). What is intriguing is that the Ly α emission line exhibits two kinematic components, including one narrow component and one broad component (FWHM > 1000 km s−1). The narrow component has a low speed (≤ 100 km s−1) and is distributed from the northern halo to the southern halo, whereas the broad component has a higher velocity and is only detected in the northern halo. Villar-Martín et al. (2003) considered the narrow component as part of quiescent halo gas. The distinct kinematics of the broad component suggests that it is an outflow driven by the jet.
The gas environments of the northern and southern halos differ. The Hα+[NII] lines and Ly α line are more extended and disturbed to the north, suggesting a more diffuse environment. This is also supported by the steeper spectral index of the northern radio lobe compared to that of the southern radio lobe (Morabito et al. 2016; Sweijen et al. 2022). Motohara et al. (2000) measured an electron density of 38 cm−3 for the northern gas and 68 cm−3 for the southern gas.
We estimated the mass outflow rate and energy outflow rate of the ionized gas using the broad Ly α component (Villar-Martín et al. 2003). The speed and luminosity of the broad Ly α component were not given in Villar-Martín et al. (2003) and so we estimated these based on the known luminosity, 1.2 × 1044 erg s−1, of the narrow Ly α component and the Ly α spectra presented in Fig. 5 of the paper. By inspecting the Ly α spectra, we found that the broad component has a similar luminosity as the narrow component and an approximate speed of 700 km s−1. We then followed Holt et al. (2006):
 (3)
(3)
where L(Ly α) is the luminosity of Ly α line, mp is the mass of proton, vout is the outflow speed, N is the electron density,  is the effective Ly α coefficient (Osterbrock 1989), h is the Planck constant, ν(Ly α) is the frequency of Ly α line, and r is the outflow radius. By adopting the distance between the northern radio lobe and the central radio core as the outflow radius, we estimate a mass outflow rate of ∼50 M⊙ yr−1 for the ionized outflow, corresponding to an energy outflow rate of ∼ 1.7 × 1043 erg s−1 using Eq. (2). These are comparable to those of the outflow detected by H I absorption. We suggest that future integral field unit (IFU) observations with a high spatial resolution could provide a more comprehensive understanding of the distribution and kinematics of the ionized gas including the outflowing component.
4.4. Feedback
Powerful jets are a main source of feedback, which could inject considerable energy into the host galaxy, perturbing gas kinematics, driving outflows, and hence regulating galaxy evolution. In hydrodynamical simulations of jet-gas interactions, induced feedback becomes efficient in dispersing gas when the ratio between jet power and AGN Eddington luminosity exceeds η ≡ Pjet/LE ∼ 10−4 (Wagner & Bicknell 2011; Wagner et al. 2012). The observed flux density of 2.7 Jy gives a rest-frame 1.4 GHz radio power of 3.7 × 1028 W Hz−1, from which we estimate a jet power of Pjet = 2.8 × 1047 erg s−1 (Cavagnolo et al. 2010). To estimate the Eddington luminosity, we also need the mass of the supermassive black hole (SMBH). Assuming η = 10−4 gives LE = 2.8 × 1051 erg s−1, corresponding to a SMBH mass of 2.5 × 10¹³ M⊙. This is unreasonably large compared to the expected 107 − 8 M⊙, and applying the expected masses gives η ≳ 10, suggesting that the jet is capable of inducing negative feedback.
A prominent observational property is the large-scale warm ionized gas emission aligned with the radio axis, ionized by the central AGN (Motohara et al. 2000; Villar-Martín et al. 2003). This is a direct result of feedback. A simple picture that can be established is that a tunnel was created due to the movement of the jet so that the central AGN radiation can directly have an effect on the gas surrounding the tunnel. This is why we see that the ionized gas is aligned with the radio axis, whereas the gas in other regions is still largely immune from AGN radiation. In the “two-stage” feedback model proposed by Hopkins & Elvis (2010), the AGN can easily disperse gas at large radii and inhibit star formation. In this model, a weak wind or outflow first breaks up the stability of dense gas in pressure equilibrium by reducing its ambient pressure. Consequently, the gas will expand perpendicularly to the outflow, which will increase the effective cross section of the gas material and make it much more susceptible to AGN radiation. In the case of 0731+438, the passage of the jet opens a putative tunnel, which could also remove the pressure equilibrium of the surrounding gas so that the subsequent AGN radiation can accelerate the gas, giving a large velocity dispersion. The observed Ly α line with large velocity FWHM (a narrow component with FWHM of 600 km s−1 and a broad component with FWHM of 1000 km s−1) supports this scenario (Villar-Martín et al. 2003). Therefore, under this condition, the feedback is negative (suppressing star formation). What is interesting is that this provides an example of a synergistic effect between the jet and AGN radiation, showing they can work together to produce feedback for the host galaxy.
It is well known that the CGM is important for galaxy growth by supplying new gas for star formation (e.g. Tumlinson et al. 2017). The outflow in 0731+438 is expelling gas away from the host galaxy, which highlights the role of the jet in impeding this process. In short, the AGN feedback (including jet-induced and AGN-radiation-induced feedback) in 0731+438 is most likely negative.
4.5. Comparison with low redshift jet-driven outflows
The detection of jet-gas interaction is not rare, usually disclosed through the alignments between radio jets and optical extended emission lines (Tadhunter et al. 2000; Villar-Martín et al. 2003). However, the detections of jet-driven neutral hydrogen outflows are rare; see Table 1 in Morganti & Oosterloo (2018). Since then, further detections have been made in IRAS 10565+2448 (Su et al. 2023b), SDSS J145239.38+062738.0 (Su et al. 2023a), and 0731+438 in this work. They are mostly seen at z < 1 and 0731+438 is the highest-redshift example of these.
It is interesting to compare the outflow in 0731+438 with previous known outflows. We used the sources with a known mass outflow rate in Table 1 of Morganti & Oosterloo (2018), in addition to IRAS 10565+2448 (Su et al. 2023b) and SDSS J145239.38+062738.0 (Su et al. 2023a). Note that some sources are detected with multiwavelength outflows, whereas others are not. For a relatively fair comparison, we only used the neutral hydrogen outflows detected with H I absorption. For the neutral hydrogen mass outflow rate of NGC 1266, we acquired it from Alatalo et al. (2011). Further, for IRAS 10565+2448, we assumed Ts = 100 K, which gives a neutral hydrogen mass outflow rate of 39 M⊙ yr−1. For 0731+438, we assumed Ts = 100 K and Ω = π/2. Moreover, for sources with a range of reported mass outflow rates, we used the central value of the range. We also calculated the rest frame 1.4 GHz monochromatic luminosity of this sample with using the NASA/IPAC Extragalactic Database (NED).
Finally, their mass outflow rate is plotted as a function of their rest frame 1.4 GHz monochromatic luminosity P1.4 in Fig. 4. It is clear that 0731+438 has the highest P1.4 and also the highest mass outflow rate. In addition, it seems that sources with higher P1.4 have a higher mass outflow rate. This is not surprising as in principle more powerful jets should drive more powerful outflows. To test it, we performed a linear fit, which gives the relation
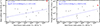 |
Fig. 4. Correlations between the neutral hydrogen outflow properties, mass outflow rate, and energy outflow rate, and the rest-frame 1.4 GHz radio power of jets. The red markers represent 0731+438. The blue lines are linear fits. |
 (4)
(4)
This fitting has a Kendall’s tau p(τ) of 0.149, indicating a possible correlation.
Furthermore, we also compared the energy outflow rate with the P1.4. We calculated the energy outflow rate in a uniform way with Eq. (2), except for SDSS J145239.38+062738.0, whose energy outflow rate was directly adopted from Su et al. (2023a). Following Morganti et al. (2005), we used the half of the full width at zero intensity (FWZI/2) of the blueshifted component as the outflow velocity, v, and FWZI/2 as the FWHM. For sources with a range of reported energy outflow rates, we used the central value of the range. The energy outflow rate as a function of the P1.4 is plotted in Fig. 4. The linear fit gives the relation
 (5)
(5)
This fitting has a Kendall’s tau p(τ) of 0.029, indicating a tentative correlation.
Note that this sample is far from complete and may be affected by biases related to host galaxy properties. A larger and more representative sample is needed to robustly test these correlations, which should currently be considered as suggestive rather than conclusive.
5. Summary
We observed 0731+438 at z = 2.429 with uGMRT observations and obtained the below results.
-
The uniform-weighting continuum image exhibits two components corresponding to two lobes in the FR II galaxy 0731+438 in previous high-spatial-resolution observations. We detected H I absorption toward 0731+438.
-
To date, this represents the third-highest redshift at which associated HI absorption has been detected. The central AGN exhibits an ionizing photon rate of at least 1.4 × 1057 s−1, which is higher than the critical value of ∼ 1056 s−1 above which the neutral hydrogen in host galaxy could be all ionized, resulting in no H I absorption detection. Our H I absorption detection in 0731+438 suggests that selecting extended radio sources rather than compact radio sources might be more efficient for detecting H I absorption at high redshift.
-
This is so far the highest-redshift jet-driven neutral hydrogen outflow detected through H I absorption. To our knowledge, this outflow has the largest radii ever reported. The outflow has a mass outflow rate of 0.4Ts Ω M⊙ yr−1 (using line 1), which could go up to 4.0Ts Ω M⊙ yr−1 (using line 2). These correspond to an energy outflow rate of 2.4Ts Ω × 1010 ∼ 1.5Ts Ω × 1041 erg s−1. Moreover, previous optical observations found a jet-driven, warm, and ionized outflow with a mass outflow rate of ∼50 M⊙ yr−1, corresponding to an energy outflow rate of ∼ 1.7 × 1043 erg s−1. Given the outflow properties, they expand the parameter space of jet-driven outflows.
-
The AGN in 0731+438 should produce a negative feedback. The alignment between the extended optical emission line and the radio axis suggests a synergistic effect between the jet and AGN radiation, showing that they can work together to produce feedback to the host galaxy. In addition, this case highlights the role of the jet in preventing CGM accretion to the host galaxy, impeding this galaxy growth.
-
Tentative correlations were found between the neutral hydrogen mass outflow rate (or energy outflow rate) and the rest-frame 1.4 GHz radio power of jets. However, a larger and less biased sample is required to further test these correlations.
Acknowledgments
We thank the anonymous referee for the comments that improve the paper. We thank the staff of the GMRT that made these observations possible. GMRT is run by the National Centre for Radio Astrophysics of the Tata Institute of Fundamental Research. This research has made use of the NASA/IPAC Extragalactic Database, which is funded by the National Aeronautics and Space Administration and operated by the California Institute of Technology. MFG is supported by the National Science Foundation of China (grant 12473019), the Shanghai Pilot Program for Basic Research-Chinese Academy of Science, Shanghai Branch (JCYJ-SHFY-2021-013), the National SKA Program of China (Grant No. 2022SKA0120102), and the China Manned Space Project with No. CMS-CSST-2025-A07. RZS acknowledges the support from the National SKA Program of China (No. 2025SKA0130100), the Shanghai Super Postdoctoral Incentive Program (No. 2025322), and the China Postdoctoral Science Foundation (Grant No. 2025M783232). M. Glowacki is supported by the Australian Government through UK STFC Grant ST/Y001117/1. M. Glowacki acknowledges support from the Inter-University Institute for Data Intensive Astronomy (IDIA). IDIA is a partnership of the University of Cape Town, the University of Pretoria and the University of the Western Cape. YJC is supported by 2023 Shanghai Oriental Talents Program.
References
- Aditya, J. N. H. S., & Kanekar, N. 2018a, MNRAS, 473, 59 [NASA ADS] [CrossRef] [Google Scholar]
- Aditya, J. N. H. S., & Kanekar, N. 2018b, MNRAS, 481, 1578 [NASA ADS] [CrossRef] [Google Scholar]
- Aditya, J. N. H. S., Kanekar, N., & Kurapati, S. 2016, MNRAS, 455, 4000 [NASA ADS] [CrossRef] [Google Scholar]
- Aditya, J. N. H. S., Jorgenson, R., Joshi, V., et al. 2021, MNRAS, 500, 998 [Google Scholar]
- Alatalo, K., Blitz, L., Young, L. M., et al. 2011, ApJ, 735, 88 [NASA ADS] [CrossRef] [Google Scholar]
- Allison, J. R., Curran, S. J., Emonts, B. H. C., et al. 2012, MNRAS, 423, 2601 [NASA ADS] [CrossRef] [Google Scholar]
- Allison, J. R., Sadler, E. M., Amaral, A. D., et al. 2022, PASA, 39 [Google Scholar]
- Carilli, C. L., Röttgering, H. J. A., van Ojik, R., Miley, G. K., & van Breugel, W. J. M. 1997, ApJS, 109, 1 [NASA ADS] [CrossRef] [Google Scholar]
- Carnall, A. C. 2017, arXiv e-prints [arXiv:1705.05165] [Google Scholar]
- CASA Team (Bean, B., et al.) 2022, PASP, 134, 114501 [NASA ADS] [CrossRef] [Google Scholar]
- Cavagnolo, K. W., McNamara, B. R., Nulsen, P. E. J., et al. 2010, ApJ, 720, 1066 [Google Scholar]
- Chandola, Y., Saikia, D. J., Ma, Y.-Z., et al. 2024, ApJ, 973, 48 [Google Scholar]
- CHIME Collaboration (Amiri, M., et al.) 2025, arXiv e-prints [arXiv:2506.11269] [Google Scholar]
- Cordun, C. M., Timmerman, R., Miley, G. K., et al. 2023, A&A, 676, A29 [NASA ADS] [CrossRef] [EDP Sciences] [Google Scholar]
- Curran, S. J. 2024, PASA, 41 [Google Scholar]
- Curran, S. J., & Whiting, M. T. 2012, ApJ, 759, 117 [NASA ADS] [CrossRef] [Google Scholar]
- Curran, S. J., Whiting, M. T., Wiklind, T., et al. 2008, MNRAS, 391, 765 [NASA ADS] [CrossRef] [Google Scholar]
- Curran, S. J., Allison, J. R., Glowacki, M., Whiting, M. T., & Sadler, E. M. 2013, MNRAS, 431, 3408 [Google Scholar]
- Curran, S. J., Allison, J. R., Whiting, M. T., et al. 2016, MNRAS, 457, 3666 [Google Scholar]
- Curran, S. J., Hunstead, R. W., Johnston, H. M., et al. 2017, MNRAS, 470, 4600 [Google Scholar]
- Derry, P. M., O’Brien, P. T., Reeves, J. N., et al. 2003, MNRAS, 342, L53 [Google Scholar]
- Grasha, K., Darling, J., Bolatto, A., Leroy, A. K., & Stocke, J. T. 2019, ApJS, 245, 3 [NASA ADS] [CrossRef] [Google Scholar]
- Gupta, N., Jagannathan, P., Srianand, R., et al. 2021a, ApJ, 907, 11 [Google Scholar]
- Gupta, N., Srianand, R., Shukla, G., et al. 2021b, ApJS, 255, 28 [NASA ADS] [CrossRef] [Google Scholar]
- Gupta, N., Srianand, R., Momjian, E., et al. 2022, ApJ, 927, L24 [NASA ADS] [CrossRef] [Google Scholar]
- Heckman, T. M. 2002, in Extragalactic Gas at Low Redshift, eds. J. S. Mulchaey, & J. T. Stocke, ASP Conf. Ser., 254, 292 [NASA ADS] [Google Scholar]
- Holt, J., Tadhunter, C., Morganti, R., et al. 2006, MNRAS, 370, 1633 [NASA ADS] [CrossRef] [Google Scholar]
- Hopkins, P. F., & Elvis, M. 2010, MNRAS, 401, 7 [NASA ADS] [CrossRef] [Google Scholar]
- Hu, W., Wang, Y., Li, Y., et al. 2025, ApJS, 277, 25 [Google Scholar]
- Maccagni, F. M., Morganti, R., Oosterloo, T. A., Geréb, K., & Maddox, N. 2017, A&A, 604, A43 [NASA ADS] [CrossRef] [EDP Sciences] [Google Scholar]
- Mahony, E. K., Morganti, R., Emonts, B. H. C., Oosterloo, T. A., & Tadhunter, C. 2013, MNRAS, 435, L58 [NASA ADS] [CrossRef] [Google Scholar]
- Morabito, L. K., Deller, A. T., Röttgering, H., et al. 2016, MNRAS, 461, 2676 [Google Scholar]
- Moore, C. B., Carilli, C. L., & Menten, K. M. 1999, ApJ, 510, L87 [Google Scholar]
- Morganti, R., & Oosterloo, T. 2018, A&A Rev., 26, 4 [Google Scholar]
- Morganti, R., Tadhunter, C. N., & Oosterloo, T. A. 2005, A&A, 444, L9 [NASA ADS] [CrossRef] [EDP Sciences] [Google Scholar]
- Morganti, R., Fogasy, J., Paragi, Z., Oosterloo, T., & Orienti, M. 2013, Science, 341, 1082 [NASA ADS] [CrossRef] [Google Scholar]
- Motohara, K., Iwamuro, F., Terada, H., et al. 2000, PASJ, 52, 33 [NASA ADS] [CrossRef] [Google Scholar]
- Mukherjee, D. 2025, arXiv e-prints [arXiv:2506.03888] [Google Scholar]
- Mukherjee, D., Bicknell, G. V., Wagner, A. Y., Sutherland, R. S., & Silk, J. 2018, MNRAS, 479, 5544 [NASA ADS] [CrossRef] [Google Scholar]
- Osterbrock, D. E. 1989, Astrophysics of Gaseous Nebulae and Active Galactic Nuclei (University Science Books) [Google Scholar]
- Röttgering, H., de Bruyn, G., & Pentericci, L. 1999, in The Most Distant Radio Galaxies, eds. H. J. A. Röttgering, P. N. Best, & M. D. Lehnert, 113 [Google Scholar]
- Schaye, J. 2001, ApJ, 562, L95 [NASA ADS] [CrossRef] [Google Scholar]
- Su, R., Sadler, E. M., Allison, J. R., et al. 2022, MNRAS, 516, 2947 [CrossRef] [Google Scholar]
- Su, R., Gu, M., Curran, S. J., et al. 2023a, ApJ, 956, L28 [Google Scholar]
- Su, R., Mahony, E. K., Gu, M., et al. 2023b, MNRAS, 520, 5712 [Google Scholar]
- Sweijen, F., Morabito, L. K., Harwood, J., et al. 2022, A&A, 658, A3 [NASA ADS] [CrossRef] [EDP Sciences] [Google Scholar]
- Tadhunter, C. N., Villar-Martin, M., Morganti, R., Bland-Hawthorn, J., & Axon, D. 2000, MNRAS, 314, 849 [NASA ADS] [CrossRef] [Google Scholar]
- Tumlinson, J., Peeples, M. S., & Werk, J. K. 2017, ARA&A, 55, 389 [Google Scholar]
- Uson, J. M., Bagri, D. S., & Cornwell, T. J. 1991, Phys. Rev. Lett., 67, 3328 [NASA ADS] [CrossRef] [Google Scholar]
- Vernet, J., Fosbury, R. A. E., Villar-Martín, M., et al. 2001, A&A, 366, 7 [NASA ADS] [CrossRef] [EDP Sciences] [Google Scholar]
- Villar-Martín, M., Vernet, J., di Serego Alighieri, S., et al. 2003, MNRAS, 346, 273 [CrossRef] [Google Scholar]
- Wagner, A. Y., & Bicknell, G. V. 2011, ApJ, 728, 29 [NASA ADS] [CrossRef] [Google Scholar]
- Wagner, A. Y., Bicknell, G. V., & Umemura, M. 2012, ApJ, 757, 136 [CrossRef] [Google Scholar]
- Yoon, H., Sadler, E. M., Mahony, E. K., et al. 2025, PASA, 42, e088 [Google Scholar]
In this paper, we define a host galaxy as either the stellar distribution observed optically or the spatial region predominantly occupied by star-forming activity.
All Tables
All Figures
|
Fig. 1. Continuum images and H I absorption moment 0 map. The black contours represent the image with natural weighting, which start at 3σ noise and increase by a factor of 2, while the green contours show the image with uniform weighting, which start at 3σ noise and increase by a factor of 2. The color image is the H I absorption moment 0 map with natural weighting. Only pixels with absorption stronger than 1.5σ are shown, where σ is the noise of the map. The right color bar shows the depth of the absorption. The map contains three unresolved regions, compared to the beam size. H I absorption lines were extracted from the peak absorption pixels of the three regions, which are presented in Fig. 2. |
| In the text | |
|
Fig. 2. H I absorption lines extracted from the peak absorption pixels of the three regions in Fig. 1.The blue lines are observed spectra, the green lines are observed spectra resampled to a velocity resolution of 50 km s−1 using SpecRes (Carnall 2017), the red lines are fit Gaussian components, and the gray lines are residuals. |
| In the text | |
|
Fig. 3. Distributions of H I column density, mass outflow rate, and energy outflow rate as a function of Ω and Tspin/f for lines 1 and 2, where Ω is the solid angle of the outflow and Tspin/f is the spin temperature divided by the covering factor. Note that the column density limits are constrained by Tspin/f > Tcmb at z = 2.4 and NHI < 3 × 10²² (Schaye 2001; Curran 2024), where Tcmb is the temperature of the cosmic microwave background. |
| In the text | |
|
Fig. 4. Correlations between the neutral hydrogen outflow properties, mass outflow rate, and energy outflow rate, and the rest-frame 1.4 GHz radio power of jets. The red markers represent 0731+438. The blue lines are linear fits. |
| In the text | |
Current usage metrics show cumulative count of Article Views (full-text article views including HTML views, PDF and ePub downloads, according to the available data) and Abstracts Views on Vision4Press platform.
Data correspond to usage on the plateform after 2015. The current usage metrics is available 48-96 hours after online publication and is updated daily on week days.
Initial download of the metrics may take a while.