Open Access
Fig. 2.
Download original image
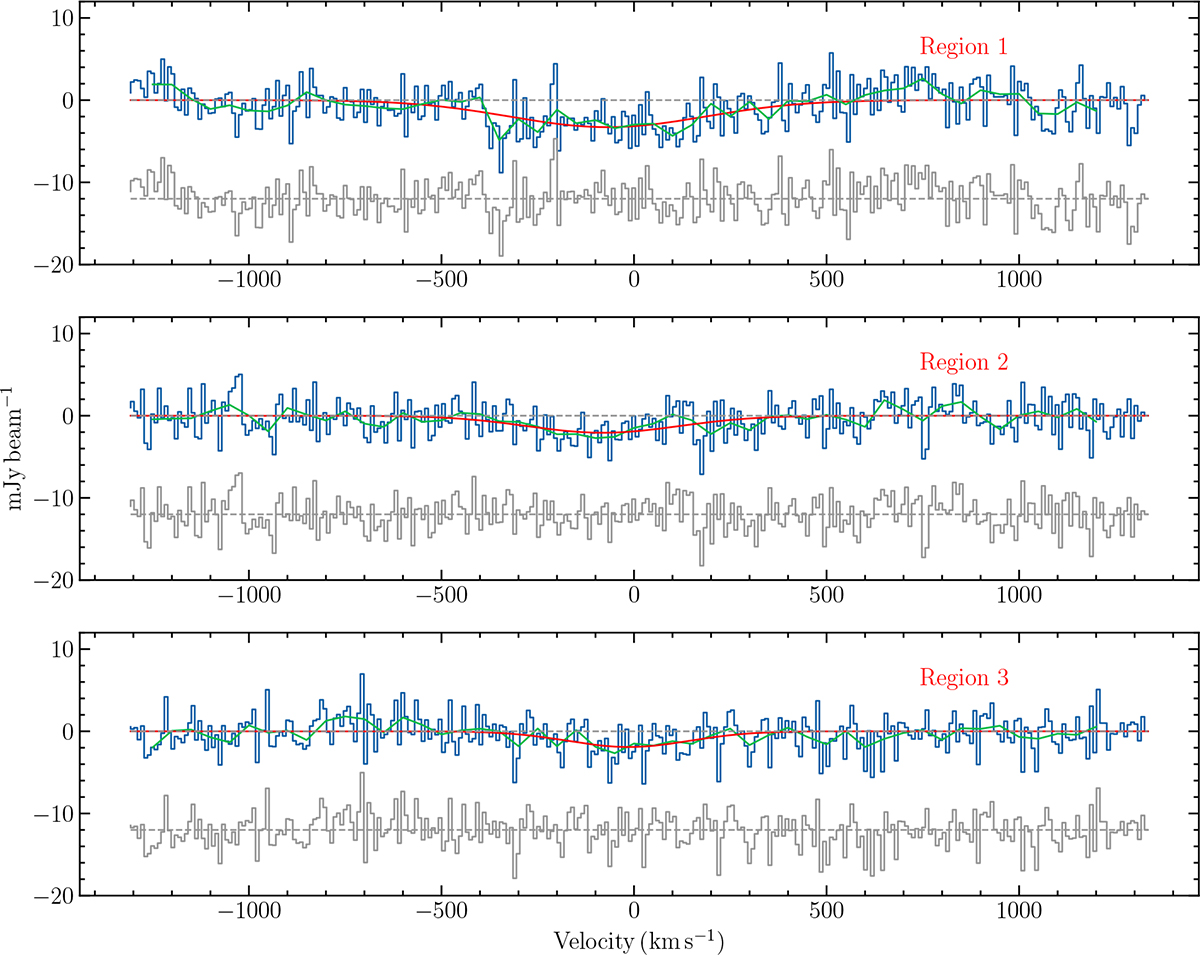
H I absorption lines extracted from the peak absorption pixels of the three regions in Fig. 1.The blue lines are observed spectra, the green lines are observed spectra resampled to a velocity resolution of 50 km s−1 using SpecRes (Carnall 2017), the red lines are fit Gaussian components, and the gray lines are residuals.
Current usage metrics show cumulative count of Article Views (full-text article views including HTML views, PDF and ePub downloads, according to the available data) and Abstracts Views on Vision4Press platform.
Data correspond to usage on the plateform after 2015. The current usage metrics is available 48-96 hours after online publication and is updated daily on week days.
Initial download of the metrics may take a while.