Fig. 10.
Download original image
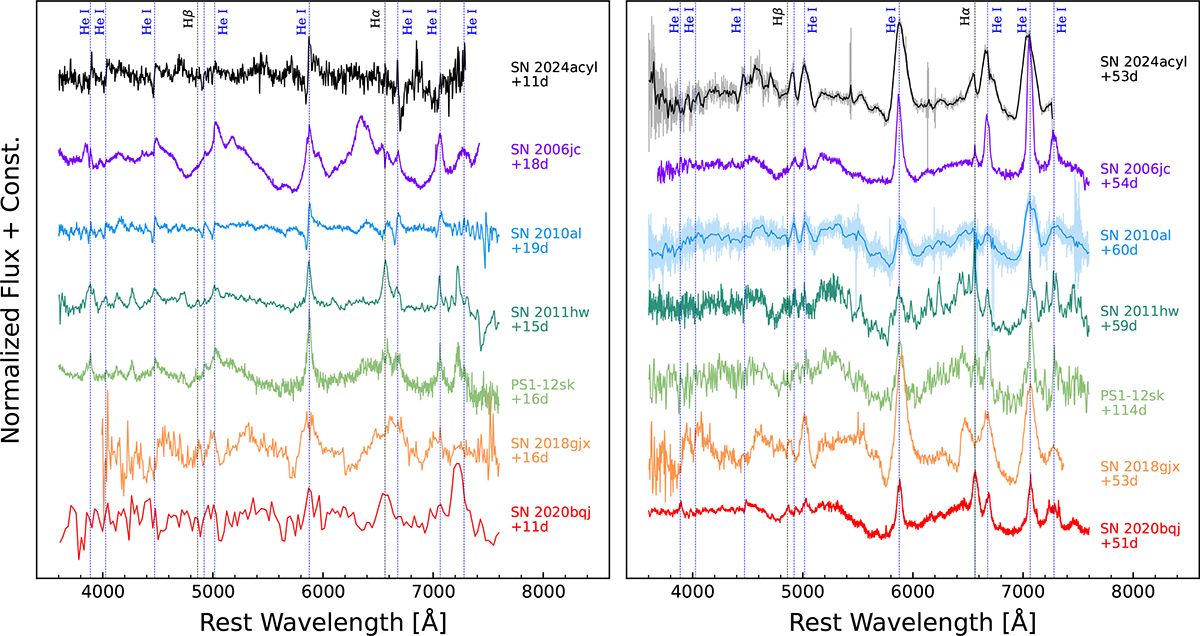
Comparisons of the spectra of SN 2024acyl at different phases with those of the transitional Type IIb/Ibn event SN 2018gjx and several Type Ibn events with H signatures, such as SNe 2006jc, 2010al, 2011hw, 2020bqj, and PS1-12sk. Left panel: Spectra obtained at around the time of maximum light (∼10 − 20 days). Right panel: late-time spectra (∼50 − 120 days). The key spectral lines (H and He) are marked with coloured dashed lines. The phases marked on the right side of each spectrum are with respect to the epoch of their maximum light. Spectra with low S/N have been binned with 20 Å; the original (unbinned) spectra are displayed in lighter colours behind. All the phases marked in the figure are related to the (approximate) explosion epoch.
Current usage metrics show cumulative count of Article Views (full-text article views including HTML views, PDF and ePub downloads, according to the available data) and Abstracts Views on Vision4Press platform.
Data correspond to usage on the plateform after 2015. The current usage metrics is available 48-96 hours after online publication and is updated daily on week days.
Initial download of the metrics may take a while.