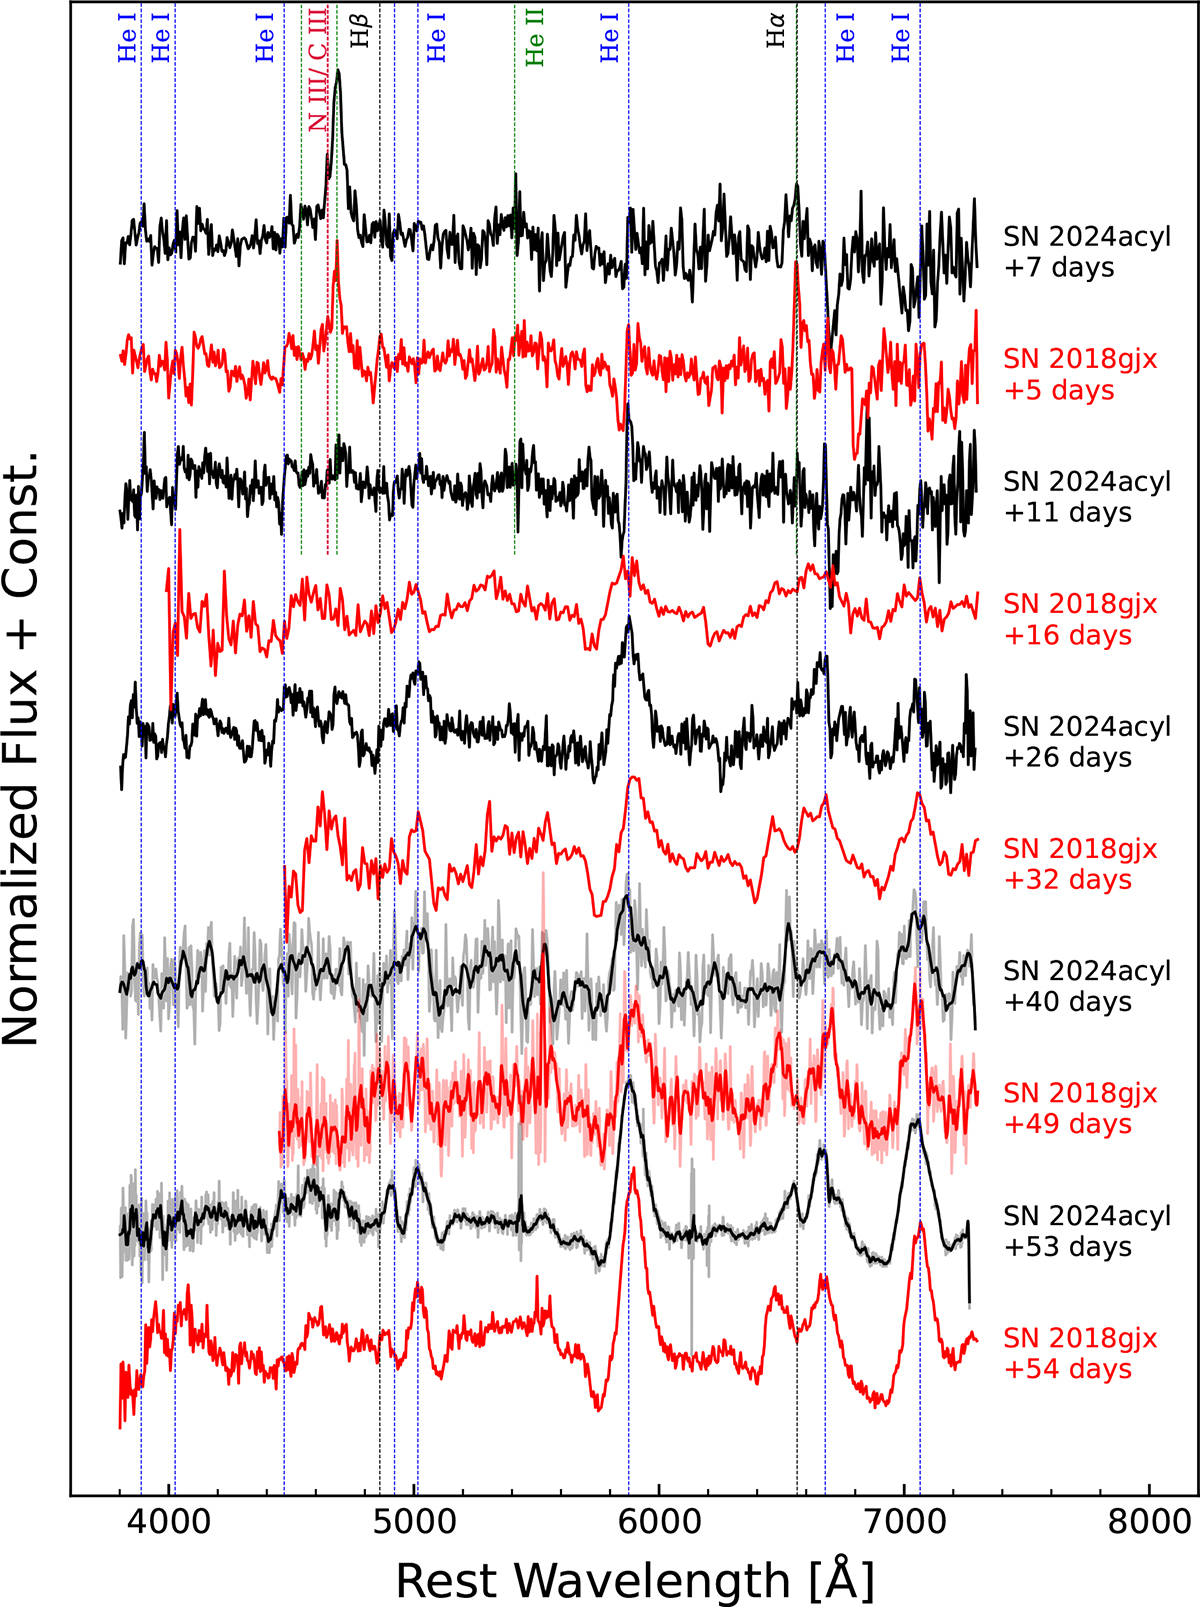
Fig. 12.
Download original image
Comparisons of the spectra of SN 2024acyl with SN 2018gjx at multiple epochs. The SN 2024acyl spectra are in red; SN 2018gjx spectra are in black. Spectra with a low S/N were binned. The original (unbinned) spectra are displayed in lighter colours behind. All the phases marked in the figure are from the (approximate) explosion epoch.
Current usage metrics show cumulative count of Article Views (full-text article views including HTML views, PDF and ePub downloads, according to the available data) and Abstracts Views on Vision4Press platform.
Data correspond to usage on the plateform after 2015. The current usage metrics is available 48-96 hours after online publication and is updated daily on week days.
Initial download of the metrics may take a while.