Fig. 7.
Download original image
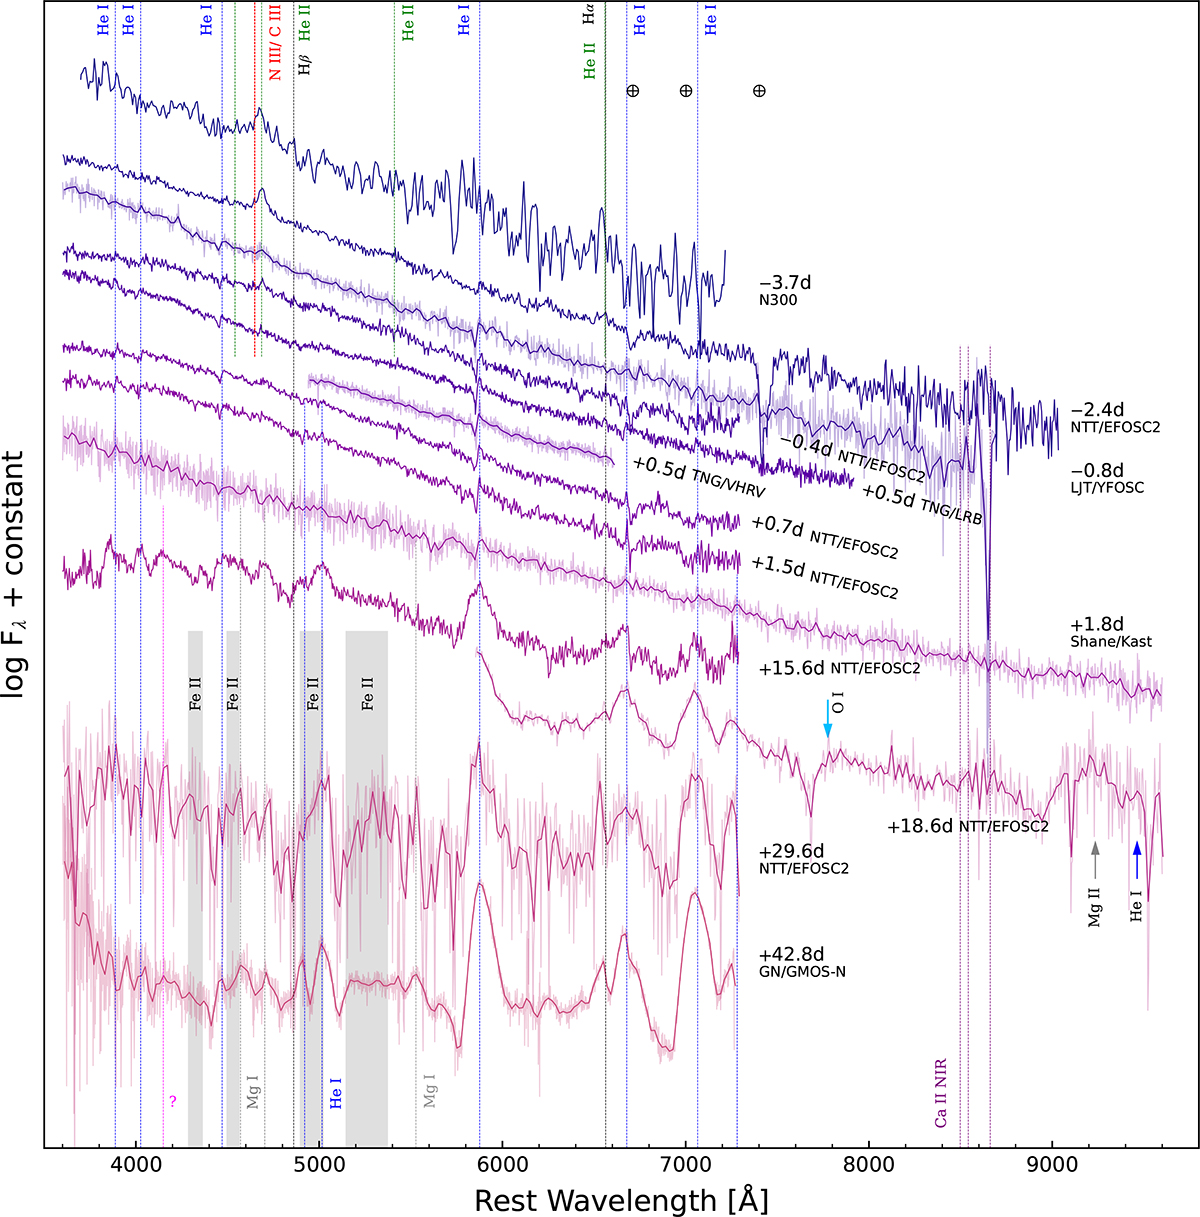
Time sequence of SN 2024acyl spectra. Some prominent features, such as He I, He II, and N III, are marked with vertical lines, while the strongest telluric absorption bands are indicated with the ⊕ symbols. The phases reported to the right of each spectrum are from the epoch of o-band maximum light (MJD = 60652.49 ± 0.26; 2024-12-08). Spectra with a low S/N were binned with 20 Å each bin; the original (unbinned) spectra are displayed in lighter colours behind. Reddening and redshift corrections have been applied to the spectra.
Current usage metrics show cumulative count of Article Views (full-text article views including HTML views, PDF and ePub downloads, according to the available data) and Abstracts Views on Vision4Press platform.
Data correspond to usage on the plateform after 2015. The current usage metrics is available 48-96 hours after online publication and is updated daily on week days.
Initial download of the metrics may take a while.