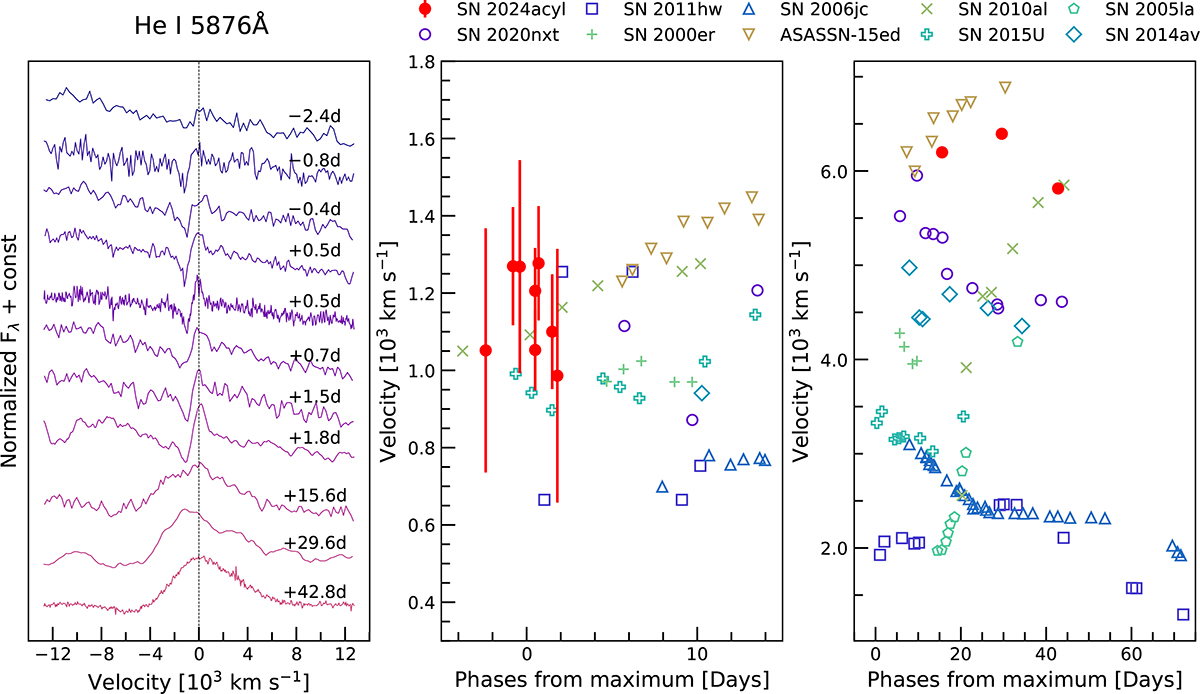
Fig. 8.
Download original image
Temporal evolution of the He Iλ5876 line. Left panel: line-profile evolution in the velocity space. The dashed vertical line marking marks the rest wavelength. Middle panel: evolution of the velocities measured from the P-Cygni absorption minimum of the narrow He I component, formed in the unshocked CSM. Right panel: evolution of the broader He I emission components, reflecting the dynamics of the shocked gas. For clarity, the uncertainties are not shown in the plots, but they can reach values of up to 30%. The comparison data for SNe Ibn are from Pastorello et al. (2016) and Wang et al. (2025).
Current usage metrics show cumulative count of Article Views (full-text article views including HTML views, PDF and ePub downloads, according to the available data) and Abstracts Views on Vision4Press platform.
Data correspond to usage on the plateform after 2015. The current usage metrics is available 48-96 hours after online publication and is updated daily on week days.
Initial download of the metrics may take a while.