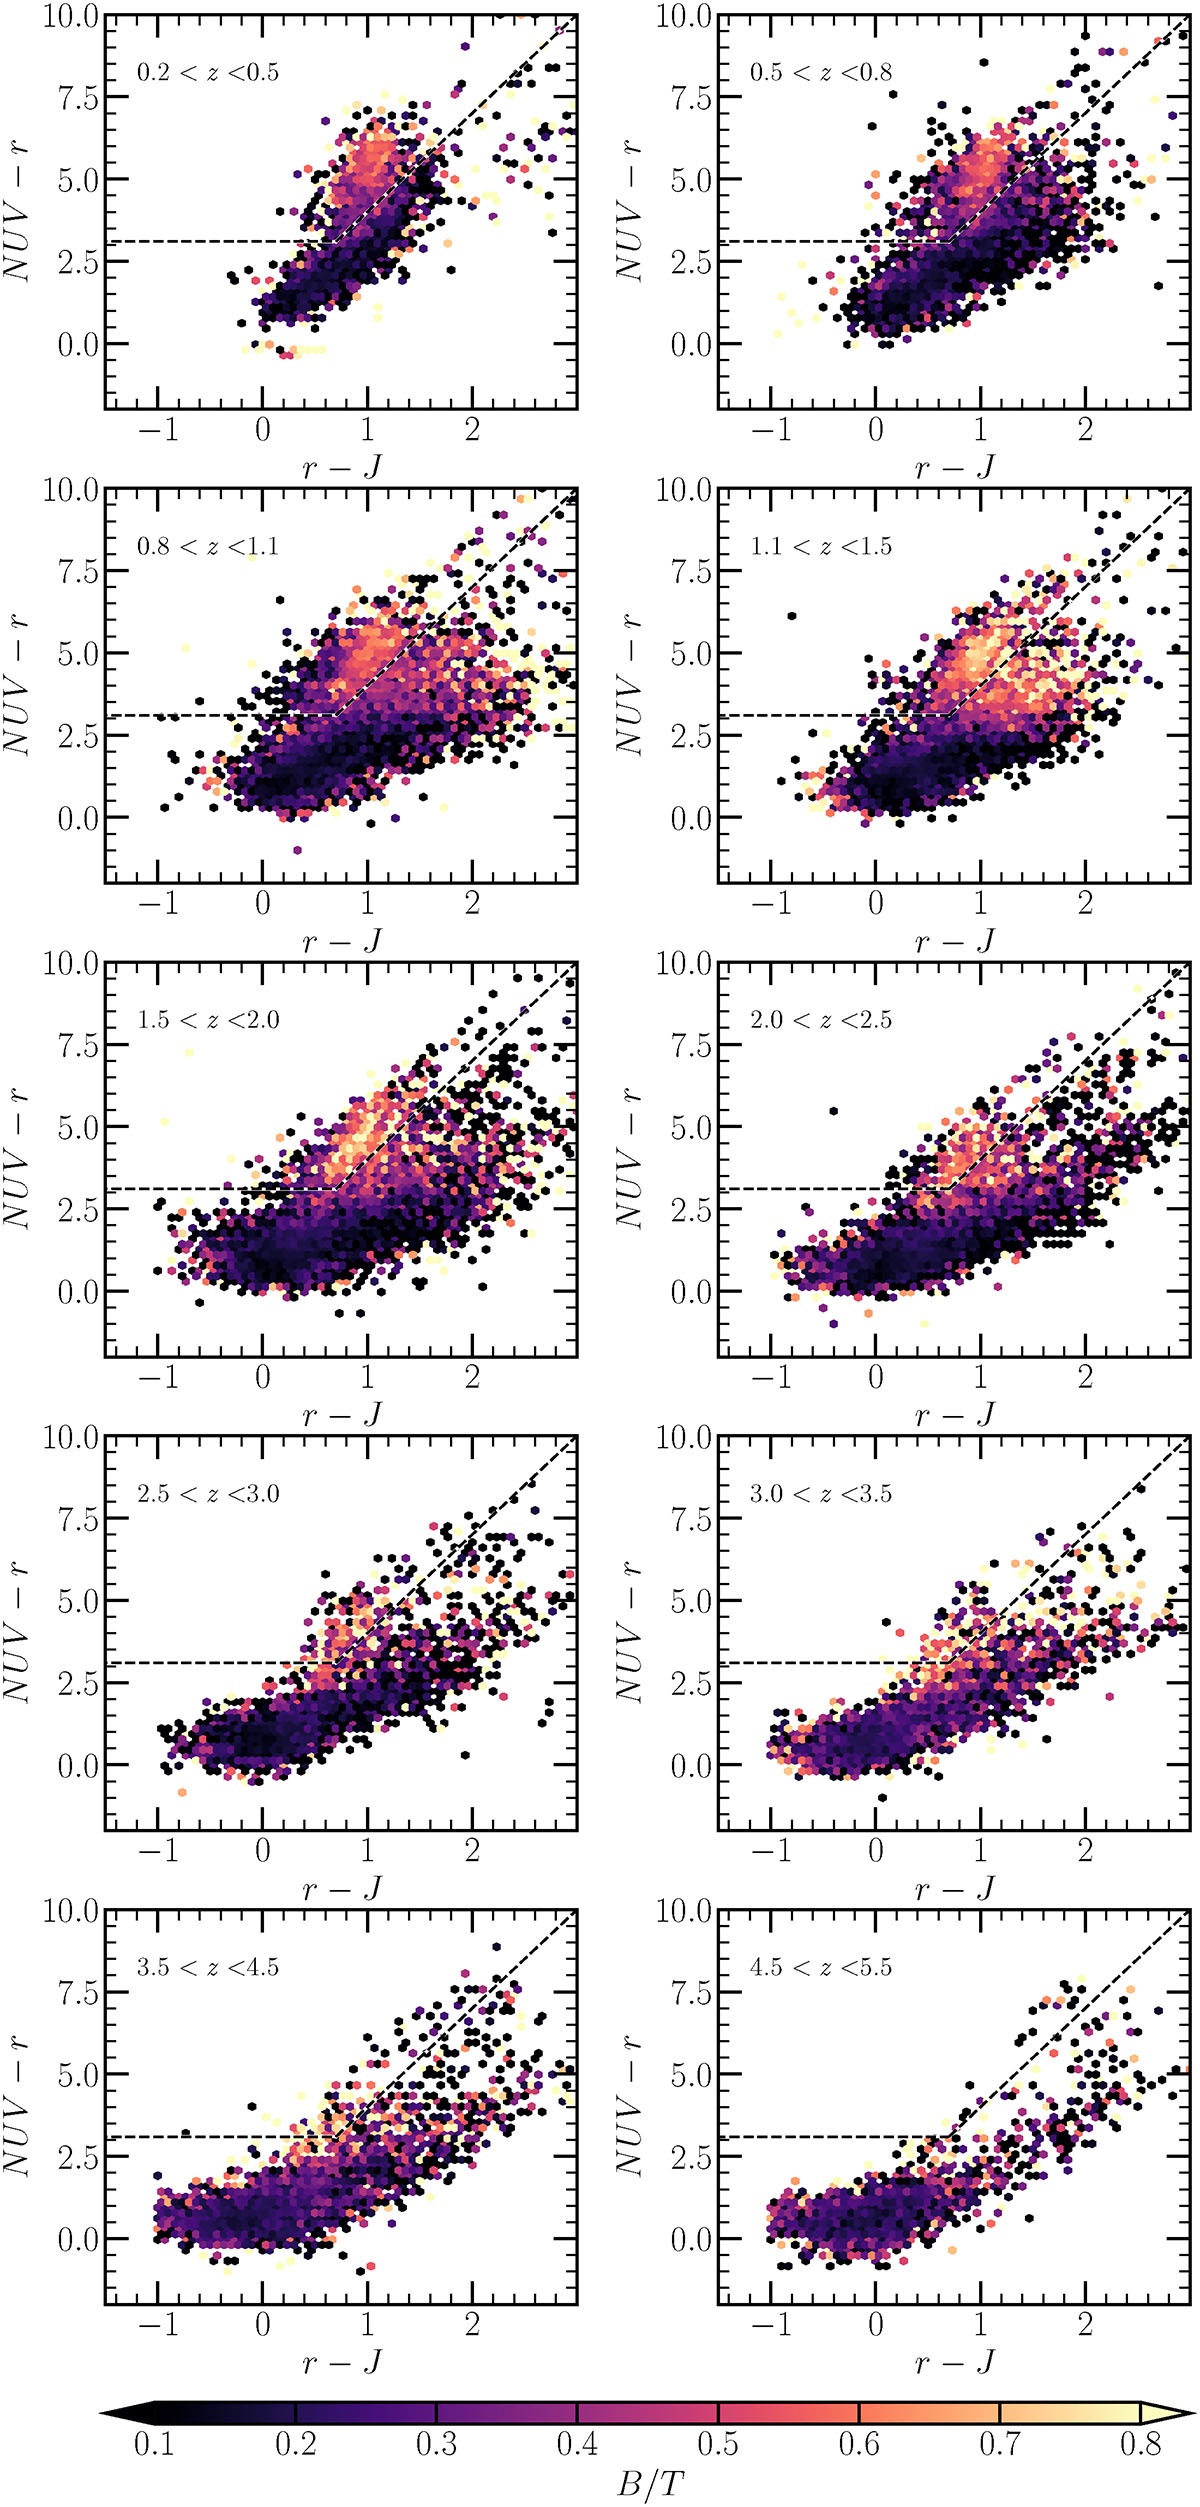
Fig. 1.
Download original image
Rest-frame NUVrJ color diagram in the ten redshift bins we used to select the samples of star-forming and quiescent galaxies separated by the dashed black line (Eq. (1)). The histogram is color-coded according to the B/T ratio F115W at z < 2, F150W at 2 < z < 3, and F277W for z > 3. It includes sources with log(M★/M⊙) > 8.5.
Current usage metrics show cumulative count of Article Views (full-text article views including HTML views, PDF and ePub downloads, according to the available data) and Abstracts Views on Vision4Press platform.
Data correspond to usage on the plateform after 2015. The current usage metrics is available 48-96 hours after online publication and is updated daily on week days.
Initial download of the metrics may take a while.