| Issue |
A&A
Volume 707, March 2026
|
|
|---|---|---|
| Article Number | A391 | |
| Number of page(s) | 19 | |
| Section | Extragalactic astronomy | |
| DOI | https://doi.org/10.1051/0004-6361/202558022 | |
| Published online | 24 March 2026 | |
The stellar mass function of quiescent and star-forming galaxies and its dependence on morphology in COSMOS-Web
1
Cosmic Dawn Center (DAWN), Denmark
2
Niels Bohr Institute, University of Copenhagen, Jagtvej 128, 2200 Copenhagen, Denmark
3
Department of Astronomy, University of Geneva, Chemin Pegasi 51, 1290 Versoix, Switzerland
4
Aix Marseille Univ, CNRS, CNES, LAM, Marseille, France
5
International Centre for Radio Astronomy Research (ICRAR), M468, University of Western Australia, 35 Stirling Hwy, Crawley, WA 6009, Australia
6
The University of Texas at Austin, 2515 Speedway Blvd Stop C1400, Austin, TX 78712, USA
7
Department of Astronomy, University of Washington Seattle, WA 98105, USA
8
Instituto de Física y Astronomía, Universidad de Valparaíso, Avda. Gran Bretana 1111 Valparaíso, Chile
9
Millennium Nucleus for Galaxies (MINGAL), Santiago, Chile
10
Université Paris-Saclay, Université Paris Cité, CEA, CNRS, AIM, 91191 Gif-sur-Yvette, France
11
Department of Computer Science, Aalto University, P.O. Box 15400, FI-00076, Espoo, Finland
12
Department of Physics, University of, P.O. Box 64, FI-00014 Helsinki, Finland
13
Department of Physics and Astronomy, University of California, Riverside, 900 University Ave, Riverside, CA 92521, USA
14
Laboratory for Multiwavelength Astrophysics, School of Physics and Astronomy, Rochester Institute of Technology, 84 Lomb Memorial Drive, Rochester, NY 14623, USA
15
Institut de Physique, GalSpec, École Polytechnique Fédérale de Lausanne, Observatoire de Sauverny, Chemin Pegasi 51, 1290 Versoix, Switzerland
16
Istituto Nazionale di Astrofisica (INAF), Astronomical Observatory of Trieste, Via Tiepolo 11, 34131 Trieste, Italy
17
Instituto de Astrofísica de Canarias (IAC), La Laguna E-38205, Spain
18
Observatoire de Paris, LERMA, PSL University, 61 avenue de l’Observatoire, F-75014 Paris, France
19
Université Paris-Cité, 5 Rue Thomas Mann, 75014 Paris, France
20
Universidad de La Laguna, Avda. Astrofísico Fco. Sanchez, La Laguna, Tenerife, Spain
21
DTU Space, Technical University of Denmark, Elektrovej, Building 328, 2800 Kgs. Lyngby, Denmark
22
Space Telescope Science Institute, 3700 San Martin Drive, Baltimore, MD 21218, USA
23
Institut d’Astrophysique de Paris, UMR 7095, CNRS, Sorbonne Université, 98 bis boulevard Arago, F-75014 Paris, France
24
European Space Agency (ESA), European Space Astronomy Centre (ESAC), Camino Bajo del Castillo s/n, 28692 Villanueva de la Cañada, Madrid, Spain
25
Istituto Nazionale di Astrofisica (INAF), Osservatorio Astronomico di Padova, Vicolo dell’Osservatorio 5, 35122 Padova, Italy
26
Department of Physics and Astronomy, UCLA, PAB 430 Portola Plaza, Box 951547, Los Angeles, CA 90095-1547, USA
27
Institute for Astronomy, University of Hawai’i at Manoa, 2680 Woodlawn Drive, Honolulu, HI 96822, USA
28
University of Bologna – Department of Physics and Astronomy “Augusto Righi” (DIFA), Via Gobetti 93/2, I-40129 Bologna, Italy
29
INAF–Osservatorio di Astrofisica e Scienza dello Spazio, Via Gobetti 93/3, I-40129 Bologna, Italy
30
Zentrum für Astronomie, Universität Heidelberg, Philosophenweg 12, D-69120 Heidelberg, Germany
31
Department of Astronomy, University of Massachusetts, Amherst, MA 01003, USA
★ Corresponding author: This email address is being protected from spambots. You need JavaScript enabled to view it.
Received:
7
November
2025
Accepted:
4
February
2026
Abstract
We study the stellar mass function (SMF) of quiescent and star-forming galaxies and its dependence on morphology in ten redshift bins at 0.2 < z < 5.5. We used the COSMOS2025 catalog, built from the 0.54 deg2 JWST imaging from the COSMOS-Web survey, to select galaxies by type using the NUVrJ rest-frame color diagram and to classify them morphologically based on their bulge-to-total light ratio (B/T). The SMF of quiescent galaxies shows a rapid early build-up, with the most massive, log(M★/M⊙)≳11, being assembled by z ∼ 1 and evolving little since. The star-forming SMF evolves more slowly with redshift, following a mass-evolution scenario where galaxies grow in mass via star formation and quench once they reach the characteristic log(M∗/M⊙) ∼ 10.6. Bulge systems (B/T > 0.6) dominate the quiescent SMF at log(M★/M⊙) > 10 at all redshifts, while disk systems (B/T < 0.2) dominate at log(M★/M⊙) < 9. However, most bulge-dominated galaxies in the Universe are star forming, with their fraction increasing with redshift and decreasing mass, consistent with them being progenitors of quiescent bulges. We find evidence for the onset of environmental quenching as early as z ∼ 3 from the upturn in the quiescent SMF at log(M★/M⊙) < 9.5. This upturn is contributed by disk-dominated galaxies, consistent with environmental quenching scenarios in which satellites are quenched, but retain their disk morphologies. The number densities of log(M★/M⊙) > 10 quiescent galaxies are lower than in the recent literature by 0.1 − 0.7 dex, but agree well with cosmological galaxy formation simulations at 2 < z < 3. However, at z > 3, simulations increasingly underpredict the observations. Finally, we built a simple empirical model to describe the redshift evolution of galaxy number densities by parameterizing the quenching rate of all and bulge-dominated galaxies, stellar fraction, and bulge formation function. Our model is consistent with an evolutionary scenario where star-forming galaxies grow a central bulge before permanently quenching in massive halos.
Key words: galaxies: abundances / galaxies: luminosity function / mass function / galaxies: statistics
© The Authors 2026
 Open Access article, published by EDP Sciences, under the terms of the Creative Commons Attribution License (https://creativecommons.org/licenses/by/4.0), which permits unrestricted use, distribution, and reproduction in any medium, provided the original work is properly cited.
This article is published in open access under the Subscribe to Open model. This email address is being protected from spambots. You need JavaScript enabled to view it. to support open access publication.
1. Introduction
Understanding how galaxies assemble their stellar mass and transition from star-forming to quiescent is a central goal of galaxy formation theory. In current models, quenching is driven by a variety of physical processes, including internal mechanisms such as bulge growth and morphological stabilization of disks (Martig et al. 2009; Dekel & Burkert 2014; Tacchella et al. 2015), feedback from active galactic nuclei (AGN, Bower et al. 2006; Croton et al. 2006; Lagos et al. 2008; Dubois et al. 2013), stellar feedback (Ferrara & Tolstoy 2000; Gelli et al. 2024), and the exhaustion of gas reservoirs (Lilly et al. 2013). Mergers can also drive quenching by inducing central starbursts and AGN activity that deplete or heat the gas (e.g., Barnes & Hernquist 1996; Hopkins et al. 2010), and they are generally considered an internally driven process triggered by external interactions. External mechanisms are driven by the environment (Peng et al. 2010) and include stripping (Gunn & Gott 1972; Moore et al. 1996), strangulation (Larson et al. 1980), and virial shock heating in halos above a mass threshold (Birnboim & Dekel 2003; Dekel & Birnboim 2006). Morphology provides a powerful tracer of these processes: bulge-dominated and disk-dominated systems encode different quenching pathways that eventually result in the population of quiescent ellipticals. However, the details of these physical processes are still poorly understood, as evidenced by the difficulty of dedicated cosmological galaxy formation simulations to reproduce the observed numbers of quiescent galaxies, especially at z ≳ 3 (e.g., Lagos et al. 2025, and references therein).
A powerful way to constrain galaxy evolution processes is through the galaxy stellar mass function (SMF), which measures the abundance of galaxies as a function of stellar mass across cosmic time. Furthermore, studying the SMF separated for star-forming and quiescent galaxies as well as by morphological class allows for an even better refinement of theoretical models.
Numerous previous works have studied the SMF for star-forming and quiescent populations from ground- and space-based observatories out to z ∼ 5 (e.g., Fontana et al. 2004; Arnouts et al. 2007; Pozzetti et al. 2010; Ilbert et al. 2010; Muzzin et al. 2013; Ilbert et al. 2013; Tomczak et al. 2014; Mortlock et al. 2015; Moutard et al. 2016; Davidzon et al. 2017; McLeod et al. 2021; Santini et al. 2022; Weaver et al. 2022). These studies revealed that the quiescent SMF builds up rapidly since z ∼ 5, while the most massive systems appear to be largely in place by z ∼ 1. At the low-mass end, a power-law upturn in the quiescent SMF has been measured out to z ∼ 2 and was often interpreted as a signature of environmental quenching (Peng et al. 2010; Santini et al. 2022). The morphological dependence of the SMF has also been explored (e.g., Bundy et al. 2005; Ilbert et al. 2010; Mortlock et al. 2015; Huertas-Company et al. 2016), showing that bulge-dominated systems shape the knee of the quiescent SMF, whereas disk-dominated galaxies shape the low-mass end. However, these studies lacked the near-IR (NIR) sensitivity to robustly detect fainter and extremely red quiescent systems and also the NIR resolution needed to trace their rest-frame optical morphology at z > 3, limiting constraints on low-mass quiescent galaxies and the morphological dependence of the SMF at early epochs.
The advent of the James Webb Space Telescope (JWST) overcomes these limitations with unprecedented NIR depth and resolution, enabling direct measurements of the quiescent SMF and its morphological dependence into the epoch of early galaxy formation. Early JWST-based studies have measured the abundances of massive quiescent galaxies at z > 2 (e.g., Valentino et al. 2023; Carnall et al. 2023, 2024; Baker et al. 2025; Zhang et al. 2026; Stevenson et al. 2026), and have started probing the low-mass end of the SMF with much improved completeness (e.g., Hamadouche et al. 2025). However, current efforts are still limited by small survey areas (≲0.2 deg2), which restrict the ability to robustly measure the abundance of the rarest and most massive systems, and the efforts are impeded by cosmic variance. Additionally, most of these works combined JWST and Hubble Space Telescope (HST) with wavelength coverage at λ ≳ 0.5 μm, which limits the application at z < 2 to derive the rest-frame colors needed to select quiescent galaxies. In addition, most works have focused on the quiescent population in isolation, but a complete picture requires treating the quiescent and star-forming populations together, since they are evolutionarily linked and a successful model must simultaneously explain the properties of both populations.
Open questions remain regarding the relative importance of different quenching channels and their dependence on stellar mass and cosmic time. In particular, it is unclear whether bulge growth is a universal prerequisite for quenching (e.g., Martig et al. 2009; Barro et al. 2013; Dekel & Burkert 2014; Zolotov et al. 2015; Tacchella et al. 2016), and if low-mass galaxies can quench without significant morphological transformation (e.g., Wuyts et al. 2011). Likewise, the onset of environmental quenching remains uncertain: while models predict that dense environments should shape the low-mass end of the quiescent SMF (Peng et al. 2010), the redshift at which these processes first become effective is still debated (De Lucia et al. 2024; Lagos et al. 2024). Although some observations have revealed systems with evidence of environmental quenching (e.g., Jin et al. 2024; Toni et al. 2026), others failed to find such evidence (e.g., Pan et al. 2025) at z ∼ 3, further fueling the debate. Addressing these questions requires simultaneous measurements of the SMF for star-forming and quiescent populations, separated by morphology, over large areas and spanning the full redshift range in which quiescent galaxies are observed.
We present the first JWST-based determination of the SMF for quiescent and star-forming galaxies along with its dependence on galaxy morphology since the first billion years. This is almost the entire cosmic history in which quiescent galaxies can be found. This is allowed by the unique combination of the deep (28 mag AB) JWST-selected sample (at ∼1 − 5 μm) over ∼0.5 deg2 from the COSMOS-Web (Casey et al. 2023) survey. Specifically, we used the COSMOS2025 catalog (Shuntov et al. 2025a), which combines dense photometric coverage in over 30 bands spanning ∼0.3 − 8 μm, allowing accurate photometric redshifts, rest-frame colors, and a classification of stellar masses and quiescent vs. star-forming objects from z ∼ 0.2 to z ∼ 5.5. We leveraged the morphological information from profile fitting of composite bulge and disk models of every source to classify disk-, bulge-dominated, and intermediate galaxies and measured the SMF for these populations.
This paper is organized as follows. In Sect. 2 we present the data and sample selection; in Sect. 3 we outline the method with which we measured and fit the SMFs; in Sect. 4 we present the results, and in Sect. 5 we discuss the physical implications of our results. We summarize and conclude in Sect. 6. We adopt a standard ΛCDM cosmology with H0 = 70 km s−1 Mpc−1 and Ωm, 0 = 0.3, where Ωb, 0 = 0.04, ΩΛ, 0 = 0.7, and σ8 = 0.82. All magnitudes are expressed in the AB system (Oke & Gunn 1983). Stellar masses were obtained assuming a Chabrier (2003) initial mass function (IMF).
2. Data and sample selection
To carry out a statistical study of quiescent and star-forming galaxies, we used the COSMOS2025 galaxy catalog, described in detail in Shuntov et al. (2025a). Briefly, COSMOS2025 is a catalog of over 700 000 galaxies based on the JWST imaging program COSMOS-Web (GO#1727, PIs: Casey & Kartaltepe, Casey et al. 2023), which provides deep NIR imaging in four NIRCam (F115W, F150W, F277W, and F444W) and one MIRI (F770W) filter over the central ∼ 0.54 deg2 (∼ 0.2 deg2 for MIRI) in COSMOS. COSMOS2025 combines these data with ground- and space-based imaging to measure the total photometry using a profile-fitting technique in 37 bands spanning 0.3 − 8 μm. Additionally, it provides morphological measurements for all sources, including Sérsic (Sérsic 1963) modeling and bulge-disk decomposition. Photometric redshifts and physical parameters are obtained from a spectral energy distribution (SED) fitting using LePHARE (Arnouts et al. 2002; Ilbert et al. 2006) as well as non-parametric star formation histories using CIGALE (Boquien et al. 2019; Arango-Toro et al. 2025). We used the physical parameters derived from LePHARE. The catalog is described in detail in Shuntov et al. (2025a,b).
Since the SMF is one of our principal measurements, we adopted the same sample as Shuntov et al. (2025b), who studied the SMF of the total population. This included the selection above a limiting magnitude corresponding to 80% completeness, removal of stars, and contamination by brown dwarfs, AGN and little red dots (LRD, Matthee et al. 2024). We briefly summarize the selection criteria in the following.
-
Sources must be brighter than the limiting magnitude mF444W < mlim, where mlim = 27.5.
-
Sources must have a stellar mass above a completeness limit M★ > Mlim(z).
-
Stars, brown dwarfs, and bright Type 1 AGN are removed using a χgal2 < χstar2, coupled with compactness criteria.
-
Sources must not satisfy the AGN/LRD criterion (AGN-SED ∨ Red) ∧ Compact, where AGN-SED: χAGN2 < χgal2, Compact:
 , Red: mF277W − mF444W > 1.5 (Akins et al. 2025).
 -
Sources must not have an X-ray counterpart by cross-matching within 1 arcsec with the Civano et al. (2016) catalog.
-
Sources must be outside of bright star masks defined in the Subaru Hyper-SuprimeCam (HSC).
This selection resulted in a total of 284 002 galaxies from z = 0.2 to z = 5.5. The effective area (after applying the HSC star masks) is ∼1551 arcmin2, or 0.431 deg2.
We computed the mass completeness limits in the same way as Shuntov et al. (2025b), following the method of Pozzetti et al. (2010). Briefly, at each z bin, we took the 30% faintest galaxies in F444W as the most representative galaxies of the population near the limiting stellar mass and derived their rescaled mass log(Mresc) = log(M★)+0.4(mF444W − mlim) by scaling the F444W magnitude to the magnitude limit of the survey (mlim). Then, we defined the limiting stellar mass as the 95th percentile of the Mresc distribution. We computed the limiting stellar mass for quiescent and star-forming galaxies separately.
We separated quiescent from star-forming galaxies using the NUVrJ rest-frame colors following Ilbert et al. (2013), Davidzon et al. (2017), Weaver et al. (2023). The near-UV (NUV) absolute magnitude is more sensitive to short timescale variation (∼10 − 100 Myr) of the star formation rate (SFR) than the U band (∼100 − 300 Myr; Arnouts et al. 2013),
 (1)
(1)
This yielded a total of 15 608 quiescent and 268 394 star-forming galaxies. Figure 1 shows the NUVrJ color diagram in the ten redshift bins we used to select the star-forming and quiescent samples, marked by the criterion of Eq. (1), shown as the dashed black line. We selected our samples in ten redshift bins from z = 0.2 to z = 5.5, identical to those in Shuntov et al. (2025b), Weaver et al. (2023), Davidzon et al. (2017), thus facilitating comparison. We note that at z ≳ 2.5, the rest-frame J band moves out of the NIRCam F444W band, and for the majority of the galaxies without MIRI F770W coverage, we relied on the best-fit template extrapolation at longer wavelengths.
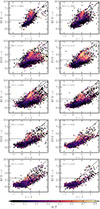 |
Fig. 1. Rest-frame NUVrJ color diagram in the ten redshift bins we used to select the samples of star-forming and quiescent galaxies separated by the dashed black line (Eq. (1)). The histogram is color-coded according to the B/T ratio F115W at z < 2, F150W at 2 < z < 3, and F277W for z > 3. It includes sources with log(M★/M⊙) > 8.5. |
We investigated the morphological dependence of the SMF using bulge-disk decomposition measurements from the COSMOS2025 catalog. Briefly, these were obtained by fitting all sources with a composite nS = 1 and nS = 4 model, where the free parameters are the total flux, the bulge-to-total ratio (B/T), the bulge and disk radii, and the axis ratios (more details in Shuntov et al. 2025a). To consistently probe the rest-frame optical emission (∼0.4 − 0.6 μm) in our redshift range, we adopted the B/T measured in F115W for z < 2, F150W for 2 < z < 3, and F277W for z > 3, following Yang et al. (2025a). We divided our samples into three morphological classes based on B/T: disk-dominated (B/T < 0.2), intermediate (0.2 < B/T < 0.6), and bulge-dominated galaxies (B/T > 0.6). These bins are motivated by the empirical correlation between B/T and Sérsic index (nS), where B/T < 0.2 and B/T > 0.6 correspond to nS ≲ 1.5 and nS ≳ 3, respectively, that is, exponential disks and de Vaucouleurs profiles (Yang et al., in prep.). The NUVrJ diagram in Fig. 1 is color-coded by the B/T and shows a gradient of increasing B/T values toward the quiescent region. Additionally, a gradient in the quiescent region extends from more disk-dominated blue r − J toward bulge-dominated red r − J systems.
We note here several caveats regarding the B/T decomposition. Even though single-component fits were made independently for all sources, we used the double-component fits, regardless of which fit was better. However, because B/T can also be 0 or 1, single-component fits (nS = 1 or nS = 4) were effectively allowed. In reality, disks and bulges exhibit a wide range of nS values, but the nS = 1 or nS = 4 approximations are acceptable for the purpose of estimating the B/T. Furthermore, a bias might arise from the surface brightness limitation of the survey: for fainter and higher-redshift sources, the disk can be near or fainter than the surface brightness limit even though they intrinsically have a disk and a bulge component. This would bias high the B/T measurement.
3. Measurements
3.1. 1/Vmax estimator for the SMF and associated uncertainties
We measured SMFs in the same way as described by Shuntov et al. (2025b). Briefly, this way consists of using the 1/Vmax estimator (Schmidt 1968) to correct for the Malmquist (1922) bias that affects the number densities of faint galaxies. The 1/Vmax weights each galaxy by the maximum volume in which it would be observed given the redshift range of the sample and magnitude limit of the survey. For each redshift bin, the SMF was computed starting from the mass completeness limit of the quiescent and star-forming samples accordingly, using a uniform bin with size Δlog M★ = 0.25.
The uncertainties in the SMF measurements include contributions from three components: 1) Poisson noise because the galaxies are counted in bins of stellar mass, σPois, and 2) SED fitting uncertainties, σSED, in the M★ estimates, caused by the photometric uncertainty and SED fitting degeneracies. These were estimated by drawing 1000 random samples from PDF(M★), computing Φ(M★) for each, and taking the standard deviation for each stellar mass bin. 3) Cosmic variance σCV, arising from the fact that our survey might be probing a biased (under- or overdense) volume of the Universe, computed following Jespersen et al. (2025), Shuntov et al. (2025b). The final uncertainty is σΦ2 = σPois2 + σSED2 + σCV2.
The SMF is also known to be affected by the Eddington (1913) bias. This is due to the exponential cutoff of the SMF, which means that lower-mass galaxies can be upscattered, thus inflating the number densities at the high-mass end. We accounted for the Eddington bias in the same way as Shuntov et al. (2025b) when fitting the functional forms of the SMF (Sect. 3.2) by convolving them with a kernel, 𝒟(M★), that describes the stellar mass uncertainty in bins of mass and redshift. We built 𝒟(M★) for each z bin and each sample (e.g., star-forming and quiescent galaxies) by stacking the PDF(M★), centered at the median of the distribution of all galaxies in the given sample. This means that the best-fit function represents the intrinsic SMF, and all quantities that are inferred from it account for the Eddington bias.
3.2. Functional forms for describing the SMF and MCMC fitting
The SMF of star-forming galaxies is typically well described by a parametric function that is a composite of a power law and an exponential cutoff function that describes the low- and high-mass ends, respectively, and it is often referred to as the Schechter (1976) function. The SMF of quiescent galaxies is commonly parameterized as a two-component Schechter function (at least out to z ∼ 2; e.g., Ilbert et al. 2013; Weaver et al. 2023; McLeod et al. 2021; Santini et al. 2022), which can theoretically be explained as the result of two different quenching mechanisms (e.g., mass- and environment-driven, Peng et al. 2010). The single Schechter function is written in terms of the logarithm of the stellar mass as
 (2)
(2)
where M* is the characteristic stellar mass that marks the so-called knee, α is the low-mass slope, and Φ* is the overall normalization. The double Schechter function is given by
![Mathematical equation: $$ \begin{aligned}&\Phi \, \mathrm{d}(\mathrm{log}M_{\star }) = \mathrm{ln}(10) \, e^{-10^{\mathrm{log}M_{\star } - \mathrm{log}M^*}} \nonumber \\&\quad \times \left[ \Phi ^*_1 \left(10^{\mathrm{log}M_{\star } - \mathrm{log} M^*}\right)^{\alpha _1+1} + \Phi ^*_2 \left(10^{\mathrm{log}M_{\star } - \mathrm{log} M^*}\right)^{\alpha _2+1} \right] \mathrm{d}( \mathrm{log}M_{\star }), \end{aligned} $$](/articles/aa/full_html/2026/03/aa58022-25/aa58022-25-eq4.gif) (3)
(3)
where the components share the same characteristic stellar mass M*, but have a different normalization Φ1* and Φ2* and low-mass slopes α1 and α2.
We fit the star-forming SMF with the single Schechter form. For the quiescent SMF, we adopted a double Schechter function out to z = 3.5 and single Schechter function in the last two bins at z > 3.5. Similarly, for the quiescent SMF separated by B/T, we used the double Schechter function out to z = 3.5 and the single Schechter funciton beyond, and we chose this empirically.
We used the Markov chain Monte Carlo (MCMC) method to fit the functional forms of the SMF via the affine-invariant ensemble sampler implemented in the emcee code (Foreman-Mackey et al. 2013). We defined a Gaussian likelihood, used 6 × nparam walkers, and defined a chain-convergence criterion using the autocorrelation time τ with the requirement that τ > 60 times the length of the chain and that the change in τ was smaller than 5%. We discarded the first 2 × max(τ) points of the chain as the burn-in phase and thinned the resulting chain by 0.5 × min(τ). We imposed flat priors on all parameters. For the double Schechter function fits, we required α1 < α2 and log(Φ2*/Φ1*) > 0. When quoting best-fit parameter values and uncertainties, we take the median and 1σ percentiles of the posterior distribution. When displaying the SMF and quantities derived from it, the median and 1σ envelopes were computed by randomly sampling the posterior 500 times. We provide the fitting results in Appendix B.
4. Results
4.1. The stellar mass function of quiescent and star-forming galaxies
We present the measurements of the SMF of quiescent and star-forming galaxies in ten redshift bins in the 0.2 < z < 5.5 range in Fig. 2. In Fig. 3 we show them in different panels for each z bin along with the best-fit functions and the 1σ confidence interval.
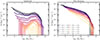 |
Fig. 2. Stellar mass function for quiescent (left) and star-forming (right) galaxies in ten redshift bins from z = 0.2 to z = 5.5. The solid lines mark the measurements, and the filled areas envelop the 1σ confidence interval including Poisson, cosmic variance, and SED-fitting errors. The SMFs are measured with a bin size of Δlog M★ = 0.25. |
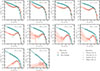 |
Fig. 3. Stellar mass function for quiescent (red) and star-forming (teal) galaxies. Each panel, corresponding to a different z bin, shows the measurements (symbols) and best-fit intrinsic functions (solid lines and envelopes). The models are also shown extrapolated beyond the measured mass range. Comparison with recent literature works includes Weaver et al. (2023), McLeod et al. (2021), Santini et al. (2022), Baker et al. (2025) in gray symbols. This work indicates, for the first time, an upturn in the quiescent SMF at log(M★/M⊙) ≲9.5 out to z ∼ 3.25. |
The quiescent SMF shows a clear mass-dependent evolution across the entire redshift range, revealed by the improved mass completeness at the low-mass end. The number densities of log(M★/M⊙) ∼11 galaxies at 0.2 < z < 4.5 increase by about 2 dex, while those of log(M★/M⊙) ∼9.5 increase by over 2.5 dex. The evolution of even lower-mass quiescent galaxies log(M★/M⊙) < 9.5 appears to be even faster, as evidenced by a flattening of the low-mass slope with increasing redshift. There is also a notable difference in the number density evolution in different epochs at the low- and high-mass end. The density of log(M★/M⊙) > 11.2 galaxies shows almost no evolution at 0.2 < z < 1.1, while it decreases by about 1 − 2 dex at z > 1.1, showing that the majority of massive galaxies have been quenched by z ∼ 1. The low-mass end, log(M★/M⊙) < 10, although showing a slower evolution at 0.2 < z < 1.1, has a considerable evolution at all redshifts, indicating that low-mass galaxies are continuously quenched throughout cosmic history.
Our measurements reveal for the first time an upturn in the quiescent SMF at log(M★/M⊙) < 9.5 out to z ∼ 3.25. Previously, this was established out to z ∼ 2.5 from studies based on HST (e.g., Santini et al. 2022) and JWST (Hamadouche et al. 2025). This drives the double Schechter form of the quiescent SMF out to z ∼ 3. However, despite the upturn in the SMF at lower masses, the number densities remain relatively low and near the volume limit of the COSMOS-Web survey, and therefore, the uncertainties are relatively high. Additionally, the exact classification of quiescent galaxies can also have a considerable effect on the inferred number densities at the low-mass end, as we discuss in Appendix A.
The star-forming SMF shows a considerably slower change across the 0.2 < z < 5.5 range, with a strong mass-dependent evolution. This is evidenced by the unchanged number densities of log(M★/M⊙) > 11.2 galaxies, at least since z ∼ 3, while log(M★/M⊙) < 10.5 galaxies, for instance, increase by about 1 dex since z ∼ 3. The star-forming SMF is expected to follow a mass evolution scenario, that is, galaxies grow in mass via star formation, which results in a horizontal shift in the SMF. For example, a growth of 1 dex in mass is required to match the SMFs at z ∼ 2.25 and z ∼ 0.3. This is further evidenced by the roughly constant low-mass slope with redshift (cf., Sect. 5.2, Fig. 9). The lack of evolution in the number densities of massive galaxies beyond the knee indicates that a quenching process that is mass dependent kicks in after galaxies grow beyond M*, and this process halts star formation and moves galaxies to the high-mass end of the quiescent SMF (Peng et al. 2010, cf., Sect. 5).
We compare our measurements with the recent literature for the case of the quiescent SMF in Fig. 3. The recent literature includes Weaver et al. (2023), McLeod et al. (2021), Santini et al. (2022) from pre-JWST studies and Baker et al. (2025) based on JWST samples, shown as gray symbols. We note that the quiescent classification is different in these studies: Weaver et al. (2023) used the NUVrJ, McLeod et al. (2021) and Santini et al. (2022) used the UVJ rest-frame colors, and Baker et al. (2025) used an sSFR-based classification. In general, the measurements agree very well at all redshifts. A notable difference is the upturn at log(M★/M⊙) < 9.5 that our work shows out to z ∼ 3.25, which is not seen in Weaver et al. (2023), likely because of our deeper detection at > 1 μm. Baker et al. (2025) analyzed 745 quiescent galaxies at log(M★/M⊙) > 9.5 and 2 < z < 7 in ∼800 arcmin2 of public JWST fields, and their SMFs agree generally with ours. However, they reported slightly increased densities of log(M★/M⊙) ∼9.5 − 10.2 galaxies at z ∼ 2.25, z ∼ 3.25 and z ∼ 4, as well as at the massive end log(M★/M⊙) > 11 at z ∼ 2.75; these differences remain within the ∼2σ uncertainties.
4.2. Morphological dependence of the stellar mass function
We investigated the morphological dependence of the quiescent and star-forming SMF by measuring it for three samples selected by their bulge-to-total ratio. This highlights the morphological populations that dominate the number densities at different stellar masses. In Fig. 4 and Fig. 5, we show the SMF for all, disk-dominated (B/T < 0.2), intermediate (0.2 < B/T < 0.6) and bulge-dominated (B/T > 0.6), for quiescent and star-forming galaxies. In this section, we first describe the quiescent SMF for the three classes and then describe it for the star-forming class.
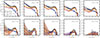 |
Fig. 4. Stellar mass function for quiescent galaxies separated by the bulge-to-total ratio. Each panel, corresponding to a different z bin, shows the measurements (symbols) and best-fit functions (solid lines and envelopes) for all quiescent (black), disk-dominated (B/T < 0.2, blue), intermediate (0.2 < B/T < 0.6, orange), and bulge-dominated galaxies (B/T > 0.6, dark red). The models are also shown extrapolated beyond the measured mass range. |
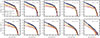 |
Fig. 5. Stellar mass function for star-forming galaxies separated by the bulge-to-total ratio. Each panel, corresponding to a different z bin, shows the measurements (symbols) and best-fit functions (solid lines and envelopes) for all quiescent (black), disk-dominated (B/T < 0.2, blue), intermediate (0.2 < B/T < 0.6, orange), and bulge-dominated galaxies (B/T > 0.6, dark red). The models are also shown extrapolated beyond the measured mass range. |
Quiescent bulge systems (B/T > 0.6) dominate the number densities of quiescent galaxies at log(M★/M⊙) ≳10 at virtually all redshifts, and they shape the knee in the SMF of the total quiescent population. This is also shown in Fig. 9, where the values of M* are similar for the total and B/T > 0.6 best-fit SMFs. Their number densities decrease with decreasing mass, and by log(M★/M⊙) ≲9, quiescent bulge systems are least abundant at all redshifts. The high-mass Schechter component that shapes the knee is sharper at high redshifts, but becomes flatter with decreasing redshift (also indicated by the flattening of the slope α2 with decreasing redshift; Fig. 9). This indicates that high-mass bulge-dominated quiescent systems form fastest, while lower-mass systems form more gradually with time and are almost as abundant as their massive counterparts by z ∼ 0.2; this is an instance of the downsizing scenario (Cowie et al. 1996; De Lucia et al. 2006; Thomas et al. 2010).
Quiescent disk systems (B/T < 0.2) dominate the quiescent SMF at masses below log(M★/M⊙) ≲9 because they have significantly steeper α1 slopes, at least out to z ∼ 1.75. Their contribution at higher redshifts becomes difficult to probe because of the limited survey depth, including the difficulty in robustly measuring the morphology via profile fitting of sources with a lower S/N. This population shows a single Schechter form, whose normalization does not appear to evolve with redshift (Fig. 9). Combined with the slope becoming shallower with increasing redshift, this results in a roughly constant abundance of massive quiescent disks with redshift (at least out to z ∼ 2.5), which have been observed (e.g., Toft et al. 2017; D’Eugenio et al. 2024; Slob et al. 2025).
Intermediate systems receive similar contributions from the bulge and disk components (0.2 < B/T < 0.6). Their SMF lies between that of the bulges and disks, but is more similar to the former. At lower redshifts (z < 1), they contribute to the high-mass end (≳M*) in the same way as the bulge-dominated systems contribute to the quiescent SMF, but their number densities decrease faster with redshift out to z ∼ 2. However, at z > 2, it closely resembles the bulge-dominated SMF. It is unclear whether this result is physical or an artifact because it is difficult to robustly measure the B/T at these redshifts where sources are dimmer.
Star-forming bulge systems (Fig. 5) are about 1 − 1.5 dex less abundant than star-forming disks at log(M★/M⊙) ≲10, but they are equally abundant at log(M★/M⊙) > 11. Regardless, the abundance of star-forming bulges is relatively high at all redshifts, with their relative abundance increasing with redshift (discussed further in Sect. 4.4 and shown in Fig. 7).
Disk systems dominate the star-forming SMF at all redshifts and masses of log(M★/M⊙) ≲11, making it the most abundant galaxy population at low and intermediate masses. This reflects the fact that star formation preferentially occurs in rotation-supported gas-rich disks where cold gas can efficiently cool and fragment (Fall & Efstathiou 1980; Kennicutt & Evans 2012). The SMF of intermediate star-forming systems lies between the two, and since this population is a mix of both, it is difficult to interpret.
Several studies in the literature have investigated the dependence of galaxy abundances on their morphology, stellar mass, and star formation activity. We qualitatively compared our measurements to similar ones from the literature. Ilbert et al. (2010) measured the SMF of quiescent and star-forming galaxies for elliptical and spiral/irregular classes in S-COSMOS out to z = 2. Our results are qualitatively consistent in finding that elliptical galaxies dominate the massive end of the quiescent SMF and that low-mass star-forming galaxies are predominantly disks. Huertas-Company et al. (2016) measured the SMF for several morphological classes based on HST observations using machine learning and obtained qualitatively consistent results. Similarly, Huertas-Company et al. (2025) used the same COSMOS-Web galaxy catalog coupled with a machine-learning-based morphological classification of essentially the same galaxies as our sample. They also reported that the massive end of the quiescent SMF is dominated by bulge systems, but revealed that the low-mass end is dominated by peculiar galaxies. As shown in Fig. A.1 of Huertas-Company et al. (2025), the peculiar class displays a mixture of disk and clumpy/irregular structures, which were fit with a low B/T profile in our work. Lang et al. (2014) performed a bulge+disk decomposition using profile fitting in H band from CANDELS (Grogin et al. 2011; Koekemoer et al. 2011) and found that the quiescent fraction increases with the B/T ratio and stellar mass, which is consistent with our trends.
4.3. Number and stellar mass densities of quiescent galaxies
The cosmic stellar mass density (SMD, ρ★) measures how much stellar content there is in a volume of the Universe and can inform us about the contributions from different galaxy populations. Along with the overall number density of quiescent galaxies, these contributions provide powerful observational benchmarks for theoretical models and simulations. Using our compilation of quiescent and star-forming galaxies along with the measured SMFs, we computed their cosmic SMD and the number density, shown in Fig. 6.
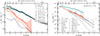 |
Fig. 6. Stellar mass and number density of quiescent and star-forming galaxies. The left panel shows the stellar mass density for total quiescent and star-forming population and for the B/T-selected quiescent samples for log(M★/M⊙) > 8. It also includes a literature comparison from recent observational studies. The right panel shows the number densities of galaxies with log(M★/M⊙) > 10 selected using the NUVrJ rest-frame colors and an sSFR/yr−1 < 0.2/tH(z) selection for the quiescent population from our work. We compare them with a compilation of simulations (lines) and observations (symbols with error bars). All are selected to have log(M★/M⊙) > 10, but the quiescent classification varies for the different observational works. In the simulations, quiescent galaxies are classified as sSFR < 5 × 10⁻¹¹ yr−1 and include uncertainties by convolving the stellar masses with Gaussian-distributed errors with a width of 0.3 dex. In our work, the sSFR selection yields ngal lower by ∼0.2 − 0.5 dex at z ≳ 4 than the NUVrJ selection. |
The SMD of quiescent and star-forming galaxies, computed by integrating the SMFs from a lower limit of log(M★/M⊙) > 8, is shown in the left panel of Fig. 6. We computed this by integrating the fit intrinsic SMFs, corrected for the Eddington bias. We also show the SMD of the B/T-selected quiescent samples, as well as the SMD of the total population, for which we took the results from Shuntov et al. (2025b). Star-forming galaxies dominate the cosmic SMD at z ≳ 0.65, with Δρ★ ≳ 1.5 dex at z > 4 compared to the quiescent one. However, the SMD of quiescent galaxies shows a steeper increase with time by about a factor of 1000 since z ∼ 5, while the star-forming SMD increased by only about a factor of 30 over the same time. The quiescent SMD equals the star-forming SMD at z ∼ 0.65 and dominates the cosmic SMD at z ≲ 0.65. This means that most of the stellar mass in the Universe today is locked in quiescent galaxies. The SMD for B/T-selected quiescent galaxies shows that most of the SMD from quiescent galaxies is locked in bulge-dominated systems.
We compared our SMD measurements with several pre-JWST works from the literature (Weaver et al. 2023; McLeod et al. 2021; Santini et al. 2022). There is very good consistency with Weaver et al. (2023), who based their analysis on COSMOS and used similar selection methods (e.g., NUVrJ colors). McLeod et al. (2021) and Santini et al. (2022) show consistent trends, but found a higher SMD of quiescent galaxies.
The number density of quiescent and star-forming galaxies with masses log(M★/M⊙) > 10 as a function of redshift is shown in the right panel of Fig. 6. This was computed by simply counting the number of galaxies and dividing by the total volume. The uncertainties include Poisson, SED fitting, and cosmic variance, incorporated using the 1σ percentiles of the fitted SMF functions. Quiescent galaxies show a steady increase in density by about a factor of 1000 since z ∼ 5, reaching ∼2 × 10⁻³ Mpc−3 by z ∼ 0.35. Massive star-forming galaxies, on the other hand, increase in number density by only about a factor of 30 (1.5 dex) over the same time span.
The number densities of quiescent galaxies have been studied extensively in the literature (e.g., Girelli et al. 2019; Carnall et al. 2020; Gould et al. 2023; Valentino et al. 2023; Carnall et al. 2023; Long et al. 2024; Baker et al. 2025; Zhang et al. 2026; Stevenson et al. 2026; Yang et al. 2025b; Merlin et al. 2025). However, different surveys and studies have shown a high degree of dispersion (∼1 − 2 dex). This can be due to quiescent classification methods (Merlin et al. 2025), but also to cosmic variance, which can significantly affect the observed number densities in smaller fields (e.g., by a factor of 2 − 3, Valentino et al. 2023). We compared our measurements conducted in the largest area probed by JWST to date with the recent literature, namely with Carnall et al. (2023), Valentino et al. (2023), Alberts et al. (2024), Nanayakkara et al. (2024), Weibel et al. (2025), Baker et al. (2025), Zhang et al. (2026), Stevenson et al. (2026). In general, we found lower number densities of quiescent galaxies by about 0.1 − 0.7 dex. The closest agreement is with Baker et al. (2025), who also analyzed a large area (∼800 arcmin2, about half the area in our work), but selected the quiescent sample with a combination of UVJ colors and sSFR cuts. At 2 ≲ z ≲ 3, they reported higher number densities by about 0.1 − 0.2 dex at 1 − 3σ compared to our work, but they are consistent at z ≳ 3.5. The consistency between these two JWST-based works, which analyzed two of the largest areas, is encouraging and shows that they are likely converging toward a real number of density of quiescent galaxies, with the effect of cosmic variance minimized. The remaining discrepancy is likely due to the different photometric bands available in both works, to the different SED fitting codes, and to the configuration of their physical prescriptions, which can affect the estimated redshifts and physical properties.
4.4. Fraction of quiescent galaxies and its dependence on morphology
We computed the fraction of quiescent and bulge-dominated galaxies as a function of stellar mass, using the number of quiescent and star-forming galaxies per mass bin. We note that by not using the best-fit Schechter functions for this, we did not account for the potential effect of the Eddington bias that might affect the measurements at the high-mass end. We propagated the Poisson, cosmic variance, and SED-fitting uncertainties to the total error bar. The results are shown in Fig. 7.
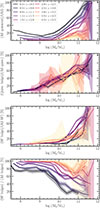 |
Fig. 7. Fraction of quiescent and bulge-dominated galaxies as a function of stellar mass in the ten redshift bins from z = 0.2 to z = 5.5. The first panel shows the fraction of quiescent to all galaxies, the second panels shows the fraction of quiescent bulges to all quiescent galaxies, the third panel shows the fraction of star-forming bulges to all star-forming galaxies, and the fourth panel shows the fraction of star-forming bulges to the total bulge population. |
The fraction of quiescent galaxies (compared to the total population), fq is shown in the first (top) panel of Fig. 7. In general, fq increases with stellar mass at all redshifts. Out to z ∼ 1.5, quiescent galaxies account for up to ∼100% of the log(M★/M⊙) ∼11.5 population. There is also a clear trend with redshift: at a given stellar mass, there are always higher fq at lower redshifts. At the highest masses that we can probe, at z ≳ 3, quiescent galaxies make up less than ∼30% of the galaxy population.
The fraction of low-mass quiescent galaxies increases with decreasing stellar mass at log(M★/M⊙) < 9, at least out to z ∼ 0.8. This might indicate a mass-dependent quenching mechanism of low-mass galaxies or a mechanism in addition to the mass-independent environmental quenching under the Peng et al. (2010) paradigm (e.g., stellar feedback Ferrara & Tolstoy 2000, discussed further in Sect. 5). These fractions indicate that ∼20% of low-mass galaxies at most have been affected by a low-mass quenching mechanism over entire cosmic history.
Next, we investigated the fraction of quiescent and star-forming galaxies with a bulge-dominated morphology (B/T > 0.6) compared to the total quiescent and star-forming population accordingly, shown in the second and third panels of Fig. 7. The fraction of quiescent bulges increases almost linearly with stellar mass at all redshifts, and bulges make up the majority of massive quiescent galaxies (≳60%) at all redshifts (albeit with large uncertainties). There is no significant trend with redshift in this case, suggesting that the quenching mechanisms of bulge-dominated galaxies are mass dependent, but constant over time. On the other hand, the fraction of star-forming bulges remains low (≲10%) out to log(M★/M⊙) ∼10 at all redshifts, after which it increases with mass. At log(M★/M⊙) ≳11.4, bulges dominate the SF population with fractions of up to ∼80 − 100%.
Finally, we computed the fraction of star-forming galaxies that are bulge dominated compared to the total bulge-dominated population (star-forming and quiescent galaxies, shown in the bottom panel). There is a clear trend with both redshift and mass, where star-forming galaxies make up most of the bulge-dominated population at high redshift. At z > 2, more than 60% of the massive (log(M★/M⊙) > 10.5) bulges were forming stars, but at later epochs, this population dwindled to ≲20% by z ∼ 0.5. This coincides with the epoch in which massive quiescent ellipticals grow rapidly (e.g., Bell et al. 2004; Cimatti et al. 2006). At z > 3, ∼100% of bulge-dominated galaxies with log(M★/M⊙) < 10 are forming stars, while this fraction decreases to ∼70% with increasing mass. At a fixed stellar mass, the fraction of star-forming bulges decreases with redshift. At z < 1, star-forming bulges make up about 80% at log(M★/M⊙) < 9, which decreases with mass to less than 20% at log(M★/M⊙) ∼11. These results confirm that there is a significant population of star-forming bulges, especially at lower masses and earlier epochs (e.g., Barro et al. 2013, 2014, 2017; Tacchella et al. 2015; Gómez-Guijarro et al. 2019). The prevalence of this population decreases with increasing mass and cosmic time, indicating an evolutionary link between star formation activity and morphology, which we discuss further in Sect. 5.4.
5. Discussion
5.1. Comparison with models and simulations
Observations of the SMF and stellar and number densities of quiescent galaxies serve as a crucial benchmark against which the physics in semianalytical models (SAM) and hydrodynamical simulations is calibrated. Our work aims to provide a comprehensive set of such benchmark observables from photometrically selected quiescent galaxies from JWST spanning z = 0.2 − 5.5. In this section, we discuss the comparison with a compilation of SAMs and hydrodynamical simulations.
In Fig. 6 (right panel) we compare the number densities of quiescent galaxies with SAMs: SHARK (Lagos et al. 2018, 2024) GALFORM (Lacey et al. 2016) and GAEA (De Lucia et al. 2024), and hydrodynamical simulations: SIMBA (Davé et al. 2019), EAGLE (Schaye et al. 2015; Crain et al. 2015), TNG100 (Springel et al. 2018; Pillepich et al. 2018), and FLARES (Lovell et al. 2021; Vijayan et al. 2022; Wilkins et al. 2023). They use the same mass selection of log(M★/M⊙) > 10, but classify quiescent using sSFR < 5 × 10⁻¹¹ yr−1. For a more just comparison, we also computed ngal using an sSFR/yr−1 < 0.2/tH(z), where tH is the Hubble time, shown in light red in Fig. 6. The stellar masses in the simulations were convolved with Gaussian-distributed errors with a width of 0.3 dex for a fairer comparison with observations. This is the same compilation as in Lagos et al. (2025), who discussed the effect of different M★ and sSFR selections. In the redshift range of 2 ≲ z ≲ 3, there is a reasonable agreement, where our measurements lie in the scatter of the different simulations. However, there is a notable trend with redshift: at z > 3, almost all simulations systematically underproduce the observed abundances of NUVrJ-quiescent galaxies, and the differences increase with redshift. The exception is SHARK, which retains good agreement at z ≳ 3.5, but overpredicts the abundances at z < 3. Our sSFR selection yields quiescent abundances that are lower by ∼0.2 − 0.5 dex at z ≳ 4 than the NUVrJ selection, and they agree better with models such as SIMBA, EAGLE, and GAEA.
We compare our quiescent SMFs in Fig. 8 with several simulations, including SHARK, GALFORM, GAEA, SIMBA, EAGLE, and TNG100, computed using a UVJ selection. There are varying degrees of agreement depending on the simulation, redshift, and mass range. In general, the simulations come closest to our measurement at z ≲ 2.5, but at higher redshifts, it becomes increasingly difficult to match the high-mass end (log(M★/M⊙) ≳10.5) with our observations. The scatter between the simulations and the observations increases with redshift. At z ∼ 3.25, all but TNG100 disagree with our SMF. While showing good agreement at lower redshifts at the high-mass end, at z > 3.5, the TNG100 SMF drops precipitously, and almost no (log(M★/M⊙) ≳10) quiescent galaxies are found. At these redshifts, EAGLE appears to come closest to our observations, while the rest of the simulations systematically underpredict the SMF at log(M★/M⊙) ≳10.2. The exception is the 4.5 < z < 5.5 bin, where SHARK and SIMBA are also within our observational error bars (which are rather large). Quenching at the high-mass end is typically regulated by the AGN feedback and black hole physics implemented in the simulations (Lagos et al. 2025, for a recent review on this topic). However, the details of the implemented AGN physics affect the quenching of intermediate- and lower-mass galaxies as well (e.g., via the hot-halo mode that can drive environmental quenching Gabor & Davé 2015). Therefore, our SMF measurements over the largest redshift and mass range to date serve as an important benchmark.
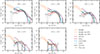 |
Fig. 8. Comparison of the observed quiescent SMF with semianalytical models and hydrodynamical simulations. These include SHARK (Lagos et al. 2018, 2024) run with two alternative runs with slow and fast ram-pressure stripping, GALFORM (Lacey et al. 2016), GAEA (De Lucia et al. 2024), SIMBA (Davé et al. 2019), EAGLE (Schaye et al. 2015; Crain et al. 2015), AND TNG100 (Springel et al. 2018; Pillepich et al. 2018). They were computed using a UVJ color selection and include uncertainties by convolving the stellar masses with a Gaussian kernel of 0.3 dex. |
At the intermediate- and low-mass end (log(M★/M⊙) ≲10), the discrepancies are highest in simulations and our measurements. The low-mass end of the SMF is shaped by the prescriptions for the physics of environmental quenching and stellar feedback (including subgrid physics in hydrodynamical simulations), and different models produce largely different results. In general, the simulations and our measurements differ. At z > 2, EAGLE and GALFORM do not show the power-law increase of the low-mass SMF, while this is visible in SHARK, SIMBA, and TNG100. To demonstrate the effect of the environmental ram pressure stripping (RPS), we show in Fig. 8 the SMF from SHARK run with a fast and slow RPS. Fast RPS produces more low-mass quiescent galaxies, but the slow RPS captures the pronounced dip in the observed SMF at log(M★/M⊙) ∼10 better. However, SHARK produces ∼0.5 − 1 dex higher abundances in this regime in general compared to our observations, even though the observed trends between galaxy group/cluster mass and satellite galaxies in the local Universe is well reproduced (Oxland et al. 2026). We discuss this further in Sect. 5.5, where we interpret our results in the context of environmental quenching.
5.2. Schechter parameter evolution with redshift and physical implications
The redshift evolution of the Schechter parameters that describe the observed SMF holds important physical insights. We show this in Fig. 9 for the total quiescent and star-forming populations (symbols with 1σ uncertainty) and for the three B/T-selected quiescent samples (lines without uncertainties for clarity).
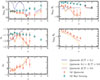 |
Fig. 9. Best-fit Schecher function parameters as a function of redshift. The symbols with error bars show the best-fit and 1σ uncertainties for the total quiescent and star-forming galaxies. The lines show the best-fit values for the disk-dominated (B/T < 0.2, blue), intermediate (0.2 < B/T < 0.6, orange), and bulge-dominated (B/T > 0.6, dark red) SMFs. |
The characteristic stellar mass is log(M*/M⊙)∼10.6, which is roughly consistent with no evolution with redshift. Out to z ∼ 1, the quiescent and star-forming SMF have the same values for M*. However, at z > 1, M* shows a mild decrease/increase with redshift for quiescent/star-forming galaxies (except in the last two bins for the quiescent galaxies). M* for the B/T-selected quiescent sample has similar values, with the bulge-dominated SMF having almost identical values, as we discussed in Sect. 4.1. One of the predictions of the Peng et al. (2010) model is that due to mass quenching, when star-forming galaxies grow beyond M*, they quench and move to the quiescent SMF, which would have the same M*. Our results show that this is the case only out to z ∼ 1. However, it remains uncertain whether this trend is significant; stellar mass uncertainties manifesting in the Eddington bias that might not be fully accounted for in our method can inflate the inferred M*. Additionally, the relatively small volume of our survey limits more robust measurements of the number densities of more massive galaxies. Robustly probing the high-mass end will be crucial in testing the mass-quenching scenario at z > 1.
The normalizations of the single and double Schechter functions Φ1 and Φ2 decrease with redshift considerably more steeply for the quiescent than for the star-forming sample, reflecting the results that we discussed in Sect. 4.1. Φ1 for bulge-dominated and intermediate galaxies shows a similar decrease as for the total population. Interestingly, Φ1 for the disk-dominated quiescent SMF remains roughly constant with redshift. This indicates a constant (in terms of number density) population of ∼M* disk-dominated quiescent galaxies.
The slope α1 for star-forming galaxies remains roughly constant with redshift with values α ∼ 1.4 and starts to steepen at z > 4. Along with the little to no evolution of M*, this means that the shape of the star-forming SMF does not change significantly since z ∼ 4. α1 for quiescent galaxies is slightly steeper by ∼0.1 − 0.5, with higher uncertainties. Within the Peng et al. (2010) model, the low-mass galaxies are quenched by environmental processes whose efficiency is independent of mass. This means that the low-mass Schechter component of the quiescent SMF closely resembles that of the star-forming one, that is, equal α1 values. The slight deviations toward steeper slopes for the quiescent SMF might be an indication that there are deviations from the mass independence of environmental quenching over larger mass ranges (> 2 dex). Our results indicate that there is an additional steepening of the very low-mass quiescent SMF in excess of the power-law slope of the Schechter component, which might indicate a third quenching mechanism acting in the lowest-mass galaxies (e.g., log(M★/M⊙) ≲8.5). This could be stellar feedback that is strong enough to expel cold gas from the gravitational potential well of low-mass galaxies (e.g., Ferrara & Tolstoy 2000; Gelli et al. 2024). However, the relatively low S/N photometry of this population and the higher uncertainty in their colors and classification prevents us from drawing more robust conclusions.
The slope α2 of the high-mass Schechter component for quiescent galaxies increases with redshift, which means that the knee of the SMF is more pronounced. Since the massive component of the quiescent SMF is built from that of the star-forming galaxies, the two must be connected. The Peng et al. (2010) model predicts that the quenching probability is simply proportional to its SFR, or more precisely, SFR/M*. This results in the quiescent and star-forming SMF, which have the same M* and slopes, related as α2 = α1,SF + 1 + β, where β ≈ 0 (e.g., Schreiber et al. 2015) is the slope of the sSFR−M★ relation; this assumes that α1,SF and M*, which is the same for the star-forming and quiescent populations, are constant with redshift. Our independent fits for the two populations show that α2 − α1, SF ∼ 1 only out to z ∼ 1 but increases with redshift. However, Porras-Valverde & Forbes (2025) demonstrated using semianalytical models that the slope α2 is related to the scatter between black hole mass and stellar mass (σBH). When we assume that the quenching probability is instead proportional to the black hole mass1, a larger scatter means a wider stellar mass range over which quenching can occur, resulting in a shallower slope. Our results of a steepening slope with increasing redshift qualitatively imply a decreasing σBH with redshift.
5.3. Quenching rates, stellar fraction, and bulge creation. Empirical modeling of the galaxy populations
We built an empirical model to describe the redshift evolution of the number densities of star-forming and quiescent galaxies nSF(z) and nQ(z) with log(M★/M⊙) > 10, which we presented in Sect. 4.3. Our starting point was the abundance-matching principle, where the assumption is that the number densities of galaxies above a stellar mass threshold are equal to that of halos above a halo mass threshold that is scaled by the baryonic fraction fb ≈ 0.16 and stellar fraction ϵ★ (Behroozi & Silk 2018).
The total galaxy number density above a threshold of M★ is related to the halo number density nh(z) through the stellar fraction dependent on redshift ϵ★(z),
 (4)
(4)
where  is simply the halo mass Mh. We modeled the number density of quiescent galaxies at a given redshift to be related to that of star-forming galaxies times a quenching rate Q(z),
 (5)
(5)
Since we wish to express this function in units of Gyr−1, we used dt/dz = −1/[(1 + z)H(z)], which is given by the cosmology, and H(z) was expressed in Gyr−1. Using Eq. (4), we write the star-forming density as
 (6)
(6)
where we omitted the mass-threshold dependence in writing the equations for brevity. Substituting Eq. (6) into Eq. (5), we obtain
![Mathematical equation: $$ \begin{aligned} \frac{d n_{\mathrm{Q} }}{dz} = \frac{dt}{dz}\, Q(z) \left[ \, n_{\mathrm{h} }(z, \epsilon _{\star }) - n_{\mathrm{Q} }(z) \right]. \end{aligned} $$](/articles/aa/full_html/2026/03/aa58022-25/aa58022-25-eq9.gif) (7)
(7)
Finally, the star-forming population follows from Eq. (6). For the quenching rate and the stellar fractions, we adopted power-law functions,
 (8)
(8)
We chose these forms empirically by testing several different forms and choosing the simplest forms that provided a good fit. We took nh as known, which we obtained from the halo mass function (HMF) calculator colossus (Diemer 2018) using the Diemer (2020) HMF. We used the numerical differential equation solver scipy.integrate.solve_ivp to integrate Eqs. (7) and (6), fit our measurements of nQ and nSF, and we constrained the parameters of Eq. (8) using emcee.
We then built a similar model to describe the bulge-dominated star-forming and quiescent populations. In this case, we assumed that bulge-dominated star-forming galaxies were created at a rate SB(z) [Mpc−3 Gyr−1], which were then quenched at a rate QB(z) to create the quiescent bulge population; this quenching then removes galaxies from the star-forming population at a rate −QB(z). This can be written as
 (9)
(9)
![Mathematical equation: $$ \begin{aligned} \frac{d n_{\mathrm{SF,B} }}{dz}&= \frac{dt}{dz}\, \left[ S_{\rm B}(z) - Q_{\rm B}(z) \, n_{\rm SF,B} \right]. \end{aligned} $$](/articles/aa/full_html/2026/03/aa58022-25/aa58022-25-eq12.gif) (10)
(10)
This simple model postulates that bulge-dominated star-forming galaxies are progenitors of bulge-dominated quiescent galaxies, and that other processes such as mergers and rejuvenation do not contribute significantly to the quiescent bulge numbers. For QB(z) and SB(z), we took a power law and a Gaussian form, which we chose empirically as the simplest form that fit the data,
![Mathematical equation: $$ \begin{aligned} Q_{\rm B}(z) = Q_{\rm B,0}\, (1+z)^{\gamma }; \ \ S_{\rm B}(z) = S_{0} \exp \!\left[ -\frac{1}{2} \left( \frac{z - z_c}{\sigma _{\rm B}} \right)^{2} \right], \end{aligned} $$](/articles/aa/full_html/2026/03/aa58022-25/aa58022-25-eq13.gif) (11)
(11)
where QB, 0 and γ are the scaling and exponent of the power law, while S0, zc and σB are the normalization, mean redshift, and standard deviation of the Gaussian. We fit the parameters using emcee by numerically solving Eqs. (9) and (10) on the observed number densities (Sect. 4.3).
We present the results in Fig. 10, where the top panel shows the measurements and best-fit models of the number densities of log(M★/M⊙) > 10 galaxies. The solid black line shows the theoretical limit of nh(1010/fb), and the dash-dotted black line shows the best-fit nh(1010/fb/ϵ★). The number density measurements are shown as open circles with error bars and are well fit by our model shown in solid (dashed) orange (dark red) and teal (dark blue) lines for the quiescent (bulge-dominated quiescent) and star-forming (bulge-dominated star-forming) populations, respectively. The bottom panels show the best-fit functions for the quenching rates of all and bulge-dominated galaxies, the stellar fraction, and bulge formation function. The best-fit model parameters are given in Table 1.
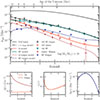 |
Fig. 10. Empirical modeling of the number densities of star-forming and quiescent galaxies as well as their bulge-dominated subpopulations. The symbols correspond to the measurements, and the curves show the best-fit models as described by the set of differential equations. The bottom panels show the best-fit parametric forms of the quenching rates, integrated SFE, and bulge formation function. |
Our empirical model shows that the stellar fraction has a nonmonotonic form that decreases with cosmic time from ∼10% at z ∼ 6 to about 6% at z ∼ 1.5 and increases out to ∼20% by z ∼ 0. These values are consistent with studies focused on the stellar-to-halo mass relation (e.g., Shuntov et al. 2022; Paquereau et al. 2025).
The quenching rate of massive (log(M★/M⊙) > 10) galaxies is about 0.17 Gyr−1, with a mild decrease with cosmic time. Given the definition of Eq. (5), this means that ∼17% of star-forming galaxies quench per 1 Gyr.
The bulge-dominated population is predominantely star forming out to z ∼ 1.5, after which nSF, B declines while quiescent bulges become more abundant, showing a constant increase with time. The star-forming bulge galaxy formation function, SB, grows by about 1 dex from z ∼ 5 to z ∼ 2, where it peaks at ∼2 × 10⁻⁴ Mpc−3 Gyr−1, and it subsequently decreases by ∼0.5 dex toward z ∼ 0. Within our framework (Eqs. (9) and (10)), this function determines the reservoir of galaxies available for quenching into the bulge-dominated quiescent population.
Star-forming bulge galaxies quench at higher rates than the overall population, with QB(z) rising from ∼30% Gyr−1 at z ∼ 6 to ∼60% Gyr−1 at z ∼ 0. This trend can be explained by the idea that permanent quenching requires the host halo to cross the critical mass scale Mh, crit ∼ 1012 M⊙, where virial shock heating and AGN-driven hot halo feedback operate (Birnboim & Dekel 2003; Kereš et al. 2005; Dekel & Burkert 2014). Since nh(> 1012 M⊙) increases with time, more halos cross this threshold at lower redshifts, raising the probability that a bulge galaxy will be quenched. In addition, the decline in cosmological gas accretion and cold inflow at late times further reduces the fuel supply, making it easier to quench at lower redshifts. Finally, once a bulge has formed, the buildup of additional stellar mass proceeds more slowly with time: a massive central bulge stabilizes the disk against fragmentation (morphological quenching; Martig et al. 2009), thereby promoting the transition to quiescence. These results are qualitatively consistent with theoretical predictions in which bulge growth, compaction events, and subsequent stabilization (e.g., Zolotov et al. 2015; Tacchella et al. 2016) play a central role in driving the quenching of massive galaxies.
We note that this is a simple empirical model that comes with caveats, such as the assumption that quiescent bulges are exclusively descendants of star-forming bulges. In reality, some fraction of quiescent disks can grow a bulge at later times, an incarnation of the so-called progenitor bias (van Dokkum & Franx 2001; Carollo et al. 2013). However, the fraction of quiescent disks is low, and therefore, this is not expected to be a dominant channel. The next step is to extend this framework to be mass dependent and fit the stellar mass functions (e.g., Drory & Alvarez 2008; Peng et al. 2010), as well as to adopt a more physically motivated model parameterization in order to provide more detailed insight into different quenching mechanisms. We leave this for future work.
5.4. Morphological transformations as prerequisite for quenching
Our results are qualitatively consistent with several theoretical frameworks that link morphological transformations to the cessation of star formation. In the compaction scenario (e.g., Dekel & Burkert 2014; Zolotov et al. 2015; Tacchella et al. 2016), bulge growth precedes quiescence: cold-gas streams at high redshifts induce violent disk instabilities and dissipative inflows that trigger central starbursts and the rapid buildup of dense stellar bulges. This is in line with our finding that the majority of bulge-dominated galaxies are star forming, with this fraction increasing at earlier times and lower stellar masses (Fig. 7, bottom panel).
Quenching then can proceed in several ways. The formation of a central bulge can stabilize the disk and suppress further central inflows. Once a bulge is in place, morphological quenching (Martig et al. 2009) becomes effective, as the deeper central potential prevents efficient fragmentation of the gas disk. The dissipative inflows and the formation of a central bulge also create conditions for rapid growth of the central black hole and triggering an AGN whose feedback quenches the galaxy. AGNs are thought to be one of the dominant mechanisms to keep the galaxy quenched by heating the halo gas (hot halo maintainance mode, Gabor & Davé 2015). In parallel, a decline in the cold gas reservoir either because of a drop in accretion rate with cosmic time or because of shock heating of inflows in massive halos and/or strong outflows leaves the stellar component dominant, whose velocity dispersion stabilizes the system and leads to a quiescent elliptical. These scenarios are also consistent with our finding that the quenching rate of bulges increases with cosmic time.
5.5. The low-mass end of the SMF as evidence of environmental quenching
The low-mass end of the quiescent SMF is thought to be shaped by environmental quenching mechanisms such as strangulation (Larson et al. 1980; Moran et al. 2007), ram-pressure stripping (Gunn & Gott 1972), and galaxy harassment (Moore et al. 1996), which operate in dense environments (Boselli & Gavazzi 2006; Peng et al. 2010; Cortese et al. 2021). This is also demonstrated in Fig. 8 by the SHARK quiescent SMF, run with different ram-pressure stripping (RPS) parameters. These models predominantly affect the low-mass end, with more aggressive RPS leading to an enhanced abundance of quenched low-mass galaxies. We refer to Oxland et al. (2026) for a thorough discussion of these different RPS models and how they affect quenching in group and cluster galaxies in SHARK.
Environmental quenching is also not expected to strongly transform galaxy morphology. As galaxies are accreted as disks into more massive halos, the denser environment, including the hot halo mode, quenches them while largely preserving their disk structure. Our results are consistent with this picture: disk systems (B/T < 0.2) dominate the low-mass quiescent SMF at all redshifts (Figs. 4 and 7), albeit with large uncertainties at z > 2.5. Taken together, the upturn of the quiescent SMF at the low-mass end and the prevalence of disk-dominated morphologies provide strong evidence for environmental quenching.
Intriguingly, our results suggest that environmental quenching is already established by z ∼ 3, as indicated by the upturn in the low-mass SMF. This might appear surprising, since group- and cluster-scale halos (which provide the virialized hot gas environments needed to heat or strip satellites) are not expected to become abundant until z ∼ 2 (e.g., Chiang et al. 2013). However, SAMs such as SHARK and GAEA (De Lucia et al. 2024) predict that environmental quenching can shape the low-mass end of the SMF at all redshifts out to z ∼ 5. Our measurements qualitatively agree with this picture out to z ∼ 3, but lack the depth (log M★ < 9) at higher redshifts to confirm or refute it. Deeper observations are needed to robustly trace this regime, but these results indicate that environment (RPS and tidal stripping) can quench low-mass galaxies at all redshifts and early times.
We caution against overinterpreting the low-mass results, which, as shown in Appendix A, are sensitive to the definition of quiescence (also, Lagos et al. 2024). The nature of low-mass potentially quiescent galaxies therefore remains uncertain. Crucially, JWST has the capability to directly test the SAM predictions: if the quiescent SMF indeed continues to rise at the low-mass end, this should be detectable with surveys that reach completeness limits of log(M★/M⊙)∼8.5 − 9 for quiescent galaxies. Spectroscopic follow-up of this population, while observationally expensive, will be essential to confirm their quiescent nature and to provide further insight into the mechanisms driving environmental quenching.
6. Conclusions
We presented the SMF measurements for quiescent and star-forming galaxies, classified by their NUVrJ rest-frame colors, in ten redshift bins at 0.2 < z < 5.5 selected from the COSMOS2025 catalog. We also investigated the morphological dependence of the SMF for both populations by separating them based on their bulge-to-total ratio into disk-dominated (B/T < 0.2), intermediate (0.2 < B/T < 0.6), and bulge-dominated galaxies (B/T > 0.6). We summarize our results below.
-
The SMFs of quiescent and star-forming galaxies shows a strong mass-dependent evolution: quiescent galaxies build up rapidly at early times until z ∼ 1. The most massive (log(M★/M⊙) ≳11) quiescent systems show little evolution at 0.2 < z < 1.1, but decline by 1–2 dex at z > 1.1, implying that most massive galaxies quenched by z ∼ 1. In contrast, star-forming SMFs evolve more slowly, consistent with steady mass growth until quenching above M* transfers galaxies to the quiescent population.
-
As a function of morphology, quiescent bulge systems dominate the number densities at log(M★/M⊙) > 10 at all redshifts, shaping the knee of the SMF. Quiescent disk systems dominate the SMF of quiescent galaxies at log(M★/M⊙) ≲9. For the star-forming population, disk systems dominate the SMF at all redshifts and masses of log(M★/M⊙) ≲11, while bulge-dominated star-forming systems contribute significantly at log(M★/M⊙) ≳11. However, most bulge-dominated galaxies in the Universe are forming stars, with their fraction increasing with redshift and decreasing mass. This is consistent with them being progenitors of quiescent bulges.
-
We measured an upturn in the quiescent SMF at the low-mass end (log(M★/M⊙) < 9.5) as early as z ∼ 3. This upturn is mostly contributed by disk-dominated galaxies, consistent with environmental quenching scenarios in which satellites are quenched, but retain their disk morphologies. These results also agree qualitatively with SAM predictions, suggesting that environmental processes can quench low-mass galaxies at early times. However, SAMs produce 0.5 − 1 dex more low-mass quiescent galaxies than are observed.
-
The stellar mass density of log(M★/M⊙) > 8 quiescent galaxies rises rapidly, and by z ∼ 0.7, it overtakes that of the star-forming population, which increases more gradually, consistent with previous results. Most of the SMD from quiescent galaxies is locked in bulge-dominated systems.
-
For the number densities of massive log(M★/M⊙) > 10 quiescent galaxies, we found values lower by 0.1 − 0.7 dex than recent literature measurements. Compared to SAMs and hydrodynamical simulations, we found good agreement at 2 < z < 3, but at z > 3, the simulations increasingly underpredict the observed number densities of quiescent galaxies.
-
We built a simple empirical model to describe the redshift evolution of the galaxy number densities that parameterizes the quenching rate of all and bulge-dominated galaxies, the stellar fraction for the total population, and the bulge formation function. The model naturally links bulge growth in star-forming galaxies to the subsequent buildup of the quiescent bulge population.
-
The quenching rate of bulge galaxies increases toward the present: as halos grow above the shock-heating threshold and the cosmological cold-gas supply declines, star-forming bulges face a rising probability per unit time of becoming and remaining quenched. This trend is qualitatively consistent with theoretical predictions of halo-driven and morphology-driven quenching mechanisms.
Taken together, our results support the scenarios that bulge-driven quenching in massive galaxies and environmentally driven quenching in low-mass systems act as complementary pathways that shape the buildup of the quiescent population across cosmic time. Complete spectroscopic surveys of low- and high-mass galaxies with JWST will be key to crystallizing the picture and to constraining the physical mechanisms that drive quenching. This work presents one of the most comprehensive measurements of the SMF and number densities of quiescent and star-forming galaxies selected from JWST. In this way, it provides a key benchmark for comparing models and simulations.
Data availability
We provide all our measurements in tabulated form at https://github.com/mShuntov/SMF-Q-SF-Morpho-paper-Shuntov25
Acknowledgments
We thank Gabriella De Lucia for providing us the SMF data from GAEA. The Cosmic Dawn Center (DAWN) is funded by the Danish National Research Foundation under grant DNRF140. This work has received funding from the Swiss State Secretariat for Education, Research and Innovation (SERI) under contract number MB22.00072. This work was made possible by utilizing the CANDIDE cluster at the Institut d’Astrophysique de Paris, which was funded through grants from the PNCG, CNES, DIM-ACAV, and the Cosmic Dawn Center and maintained by S. Rouberol. French COSMOS team members are partly supported by the Centre National d’Etudes Spatiales (CNES). We acknowledge the funding of the French Agence Nationale de la Recherche for the project iMAGE (grant ANR-22-CE31-0007). GEM acknowledges the Villum Fonden research grants 37440 and 13160.
References
- Akins, H. B., Casey, C. M., Lambrides, E., et al. 2025, ApJ, 991, 37 [Google Scholar]
- Alberts, S., Williams, C. C., Helton, J. M., et al. 2024, ApJ, 975, 85 [Google Scholar]
- Arango-Toro, R. C., Ilbert, O., Ciesla, L., et al. 2025, A&A, 696, A159 [NASA ADS] [CrossRef] [EDP Sciences] [Google Scholar]
- Arnouts, S., Moscardini, L., Vanzella, E., et al. 2002, MNRAS, 329, 355 [Google Scholar]
- Arnouts, S., Walcher, C. J., Le Fèvre, O., et al. 2007, A&A, 476, 137 [CrossRef] [EDP Sciences] [Google Scholar]
- Arnouts, S., Le Floc’h, E., Chevallard, J., et al. 2013, A&A, 558, A67 [NASA ADS] [CrossRef] [EDP Sciences] [Google Scholar]
- Baker, W. M., Valentino, F., Lagos, C. d. P., et al. 2025, A&A, 702, A270 [NASA ADS] [CrossRef] [EDP Sciences] [Google Scholar]
- Barnes, J. E., & Hernquist, L. 1996, ApJ, 471, 115 [NASA ADS] [CrossRef] [Google Scholar]
- Barro, G., Faber, S. M., Pérez-González, P. G., et al. 2013, ApJ, 765, 104 [Google Scholar]
- Barro, G., Faber, S. M., Pérez-González, P. G., et al. 2014, ApJ, 791, 52 [Google Scholar]
- Barro, G., Faber, S. M., Koo, D. C., et al. 2017, ApJ, 840, 47 [Google Scholar]
- Behroozi, P., & Silk, J. 2018, MNRAS, 477, 5382 [Google Scholar]
- Bell, E. F., Wolf, C., Meisenheimer, K., et al. 2004, ApJ, 608, 752 [NASA ADS] [CrossRef] [Google Scholar]
- Birnboim, Y., & Dekel, A. 2003, MNRAS, 345, 349 [Google Scholar]
- Boquien, M., Burgarella, D., Roehlly, Y., et al. 2019, A&A, 622, A103 [NASA ADS] [CrossRef] [EDP Sciences] [Google Scholar]
- Boselli, A., & Gavazzi, G. 2006, PASP, 118, 517 [Google Scholar]
- Bower, R. G., Benson, A. J., Malbon, R., et al. 2006, MNRAS, 370, 645 [Google Scholar]
- Bundy, K., Ellis, R. S., & Conselice, C. J. 2005, ApJ, 625, 621 [NASA ADS] [CrossRef] [Google Scholar]
- Carnall, A. C., McLure, R. J., Dunlop, J. S., & Davé, R. 2018, MNRAS, 480, 4379 [Google Scholar]
- Carnall, A. C., Walker, S., McLure, R. J., et al. 2020, MNRAS, 496, 695 [Google Scholar]
- Carnall, A. C., McLeod, D. J., McLure, R. J., et al. 2023, MNRAS, 520, 3974 [NASA ADS] [CrossRef] [Google Scholar]
- Carnall, A. C., Cullen, F., McLure, R. J., et al. 2024, MNRAS, 534, 325 [NASA ADS] [CrossRef] [Google Scholar]
- Carollo, C. M., Bschorr, T. J., Renzini, A., et al. 2013, ApJ, 773, 112 [NASA ADS] [CrossRef] [Google Scholar]
- Casey, C. M., Kartaltepe, J. S., Drakos, N. E., et al. 2023, ApJ, 954, 31 [NASA ADS] [CrossRef] [Google Scholar]
- Chabrier, G. 2003, PASP, 115, 763 [Google Scholar]
- Chiang, Y.-K., Overzier, R., & Gebhardt, K. 2013, ApJ, 779, 127 [Google Scholar]
- Cimatti, A., Daddi, E., & Renzini, A. 2006, A&A, 453, L29 [NASA ADS] [CrossRef] [EDP Sciences] [Google Scholar]
- Civano, F., Marchesi, S., Comastri, A., et al. 2016, ApJ, 819, 62 [Google Scholar]
- Cortese, L., Catinella, B., & Smith, R. 2021, PASA, 38, e035 [NASA ADS] [CrossRef] [Google Scholar]
- Cowie, L. L., Songaila, A., Hu, E. M., & Cohen, J. G. 1996, AJ, 112, 839 [Google Scholar]
- Crain, R. A., Schaye, J., Bower, R. G., et al. 2015, MNRAS, 450, 1937 [NASA ADS] [CrossRef] [Google Scholar]
- Croton, D. J., Springel, V., White, S. D. M., et al. 2006, MNRAS, 365, 11 [Google Scholar]
- Daddi, E., Alexander, D. M., Dickinson, M., et al. 2007, ApJ, 670, 173 [NASA ADS] [CrossRef] [Google Scholar]
- Davé, R., Anglés-Alcázar, D., Narayanan, D., et al. 2019, MNRAS, 486, 2827 [Google Scholar]
- Davidzon, I., Ilbert, O., Laigle, C., et al. 2017, A&A, 605, A70 [NASA ADS] [CrossRef] [EDP Sciences] [Google Scholar]
- De Lucia, G., Springel, V., White, S. D. M., Croton, D., & Kauffmann, G. 2006, MNRAS, 366, 499 [NASA ADS] [CrossRef] [Google Scholar]
- De Lucia, G., Fontanot, F., Xie, L., & Hirschmann, M. 2024, A&A, 687, A68 [NASA ADS] [CrossRef] [EDP Sciences] [Google Scholar]
- Dekel, A., & Birnboim, Y. 2006, MNRAS, 368, 2 [NASA ADS] [CrossRef] [Google Scholar]
- Dekel, A., & Burkert, A. 2014, MNRAS, 438, 1870 [Google Scholar]
- D’Eugenio, F., Pérez-González, P. G., Maiolino, R., et al. 2024, Nat. Astron., 8, 1443 [CrossRef] [Google Scholar]
- Diemer, B. 2018, ApJS, 239, 35 [NASA ADS] [CrossRef] [Google Scholar]
- Diemer, B. 2020, ApJ, 903, 87 [NASA ADS] [CrossRef] [Google Scholar]
- Drory, N., & Alvarez, M. 2008, ApJ, 680, 41 [Google Scholar]
- Dubois, Y., Gavazzi, R., Peirani, S., & Silk, J. 2013, MNRAS, 433, 3297 [CrossRef] [Google Scholar]
- Eddington, A. S. 1913, MNRAS, 73, 359 [Google Scholar]
- Fall, S. M., & Efstathiou, G. 1980, MNRAS, 193, 189 [NASA ADS] [CrossRef] [Google Scholar]
- Ferrara, A., & Tolstoy, E. 2000, MNRAS, 313, 291 [NASA ADS] [CrossRef] [Google Scholar]
- Fontana, A., Pozzetti, L., Donnarumma, I., et al. 2004, A&A, 424, 23 [NASA ADS] [CrossRef] [EDP Sciences] [Google Scholar]
- Fontana, A., Santini, P., Grazian, A., et al. 2009, A&A, 501, 15 [NASA ADS] [CrossRef] [EDP Sciences] [Google Scholar]
- Foreman-Mackey, D., Hogg, D. W., Lang, D., & Goodman, J. 2013, PASP, 125, 306 [Google Scholar]
- Gabor, J. M., & Davé, R. 2015, MNRAS, 447, 374 [NASA ADS] [CrossRef] [Google Scholar]
- Gelli, V., Salvadori, S., Ferrara, A., & Pallottini, A. 2024, ApJ, 964, 76 [NASA ADS] [CrossRef] [Google Scholar]
- Girelli, G., Bolzonella, M., & Cimatti, A. 2019, A&A, 632, A80 [NASA ADS] [CrossRef] [EDP Sciences] [Google Scholar]
- Gómez-Guijarro, C., Magdis, G. E., Valentino, F., et al. 2019, ApJ, 886, 88 [Google Scholar]
- Gould, K. M. L., Brammer, G., Valentino, F., et al. 2023, AJ, 165, 248 [NASA ADS] [CrossRef] [Google Scholar]
- Grogin, N. A., Kocevski, D. D., Faber, S. M., et al. 2011, ApJS, 197, 35 [NASA ADS] [CrossRef] [Google Scholar]
- Gunn, J. E., & Gott, J. R., III. 1972, ApJ, 176, 1 [NASA ADS] [CrossRef] [Google Scholar]
- Hamadouche, M. L., McLure, R. J., Carnall, A. C., et al. 2025, MNRAS, 541, 463 [Google Scholar]
- Hopkins, P. F., Bundy, K., Croton, D., et al. 2010, ApJ, 715, 202 [Google Scholar]
- Huertas-Company, M., Bernardi, M., Pérez-González, P. G., et al. 2016, MNRAS, 462, 4495 [CrossRef] [Google Scholar]
- Huertas-Company, M., Shuntov, M., Dong, Y., et al. 2025, A&A, 704, A94 [NASA ADS] [CrossRef] [EDP Sciences] [Google Scholar]
- Ilbert, O., Arnouts, S., McCracken, H. J., et al. 2006, A&A, 457, 841 [NASA ADS] [CrossRef] [EDP Sciences] [Google Scholar]
- Ilbert, O., Salvato, M., Le Floc’h, E., et al. 2010, ApJ, 709, 644 [Google Scholar]
- Ilbert, O., McCracken, H. J., Le Fèvre, O., et al. 2013, A&A, 556, A55 [NASA ADS] [CrossRef] [EDP Sciences] [Google Scholar]
- Jespersen, C. K., Steinhardt, C. L., Somerville, R. S., & Lovell, C. C. 2025, ApJ, 982, 23 [Google Scholar]
- Jin, S., Sillassen, N. B., Magdis, G. E., et al. 2024, A&A, 683, L4 [NASA ADS] [CrossRef] [EDP Sciences] [Google Scholar]
- Kennicutt, R. C., & Evans, N. J. 2012, ARA&A, 50, 531 [NASA ADS] [CrossRef] [Google Scholar]
- Kereš, D., Katz, N., Weinberg, D. H., & Davé, R. 2005, MNRAS, 363, 2 [Google Scholar]
- Koekemoer, A. M., Faber, S. M., Ferguson, H. C., et al. 2011, ApJS, 197, 36 [NASA ADS] [CrossRef] [Google Scholar]
- Lacey, C. G., Baugh, C. M., Frenk, C. S., et al. 2016, MNRAS, 462, 3854 [Google Scholar]
- Lagos, C. D. P., Cora, S. A., & Padilla, N. D. 2008, MNRAS, 388, 587 [Google Scholar]
- Lagos, C. d. P., Tobar, R. J., Robotham, A. S. G., et al. 2018, MNRAS, 481, 3573 [CrossRef] [Google Scholar]
- Lagos, C. d. P., Bravo, M., Tobar, R., et al. 2024, MNRAS, 531, 3551 [CrossRef] [Google Scholar]
- Lagos, C. d. P., Valentino, F., Wright, R. J., et al. 2025, MNRAS, 536, 2324 [Google Scholar]
- Lang, P., Wuyts, S., Somerville, R. S., et al. 2014, ApJ, 788, 11 [NASA ADS] [CrossRef] [Google Scholar]
- Larson, R. B., Tinsley, B. M., & Caldwell, C. N. 1980, ApJ, 237, 692 [Google Scholar]
- Lilly, S. J., Carollo, C. M., Pipino, A., Renzini, A., & Peng, Y. 2013, ApJ, 772, 119 [NASA ADS] [CrossRef] [Google Scholar]
- Long, A. S., Antwi-Danso, J., Lambrides, E. L., et al. 2024, ApJ, 970, 68 [Google Scholar]
- Lovell, C. C., Vijayan, A. P., Thomas, P. A., et al. 2021, MNRAS, 500, 2127 [Google Scholar]
- Malmquist, K. G. 1922, Lund Medd Ser. I, 100, 1 [Google Scholar]
- Martig, M., Bournaud, F., Teyssier, R., & Dekel, A. 2009, ApJ, 707, 250 [Google Scholar]
- Matthee, J., Naidu, R. P., Brammer, G., et al. 2024, ApJ, 963, 129 [NASA ADS] [CrossRef] [Google Scholar]
- McLeod, D. J., McLure, R. J., Dunlop, J. S., et al. 2021, MNRAS, 503, 4413 [NASA ADS] [CrossRef] [Google Scholar]
- Merlin, E., Fortuni, F., Calabró, A., et al. 2025, Open J. Astrophys., 8, E170 [Google Scholar]
- Moore, B., Katz, N., Lake, G., Dressler, A., & Oemler, A. 1996, Nature, 379, 613 [Google Scholar]
- Moran, S. M., Ellis, R. S., Treu, T., et al. 2007, ApJ, 671, 1503 [Google Scholar]
- Mortlock, A., Conselice, C. J., Hartley, W. G., et al. 2015, MNRAS, 447, 2 [NASA ADS] [CrossRef] [Google Scholar]
- Moutard, T., Arnouts, S., Ilbert, O., et al. 2016, A&A, 590, A103 [NASA ADS] [CrossRef] [EDP Sciences] [Google Scholar]
- Muzzin, A., Marchesini, D., Stefanon, M., et al. 2013, ApJ, 777, 18 [NASA ADS] [CrossRef] [Google Scholar]
- Nanayakkara, T., Glazebrook, K., Jacobs, C., et al. 2024, Sci. Rep., 14, 3724 [NASA ADS] [CrossRef] [Google Scholar]
- Oke, J. B., & Gunn, J. E. 1983, ApJ, 266, 713 [NASA ADS] [CrossRef] [Google Scholar]
- Oxland, M. K., Bravo, M., Parker, L. C., & Lagos, C. d. P. 2026, ApJ, 999, 38 [Google Scholar]
- Pacifici, C., Kassin, S. A., Weiner, B. J., et al. 2016, ApJ, 832, 79 [Google Scholar]
- Pan, R., Suess, K. A., Marchesini, D., et al. 2025, ApJ, 990, L24 [Google Scholar]
- Paquereau, L., Laigle, C., McCracken, H. J., et al. 2025, A&A, 702, A163 [NASA ADS] [CrossRef] [EDP Sciences] [Google Scholar]
- Peng, Y., Lilly, S. J., Kovac, K., et al. 2010, ApJ, 721, 193 [NASA ADS] [CrossRef] [Google Scholar]
- Pillepich, A., Nelson, D., Hernquist, L., et al. 2018, MNRAS, 475, 648 [Google Scholar]
- Porras-Valverde, A. J., & Forbes, J. C. 2025, ApJ, 984, 96 [Google Scholar]
- Pozzetti, L., Bolzonella, M., Zucca, E., et al. 2010, A&A, 523, A13 [NASA ADS] [CrossRef] [EDP Sciences] [Google Scholar]
- Santini, P., Castellano, M., Fontana, A., et al. 2022, ApJ, 940, 135 [NASA ADS] [CrossRef] [Google Scholar]
- Schaye, J., Crain, R. A., Bower, R. G., et al. 2015, MNRAS, 446, 521 [Google Scholar]
- Schechter, P. 1976, ApJ, 203, 297 [Google Scholar]
- Schmidt, M. 1968, ApJ, 151, 393 [Google Scholar]
- Schreiber, C., Pannella, M., Elbaz, D., et al. 2015, A&A, 575, A74 [NASA ADS] [CrossRef] [EDP Sciences] [Google Scholar]
- Sérsic, J. L. 1963, Boletin de la Asociacion Argentina de Astronomia La Plata Argentina, 6, 41 [Google Scholar]
- Shuntov, M., McCracken, H. J., Gavazzi, R., et al. 2022, A&A, 664, A61 [NASA ADS] [CrossRef] [EDP Sciences] [Google Scholar]
- Shuntov, M., Akins, H. B., Paquereau, L., et al. 2025a, A&A, 704, A339 [NASA ADS] [CrossRef] [EDP Sciences] [Google Scholar]
- Shuntov, M., Ilbert, O., Toft, S., et al. 2025b, A&A, 695, A20 [NASA ADS] [CrossRef] [EDP Sciences] [Google Scholar]
- Silverman, J. D., Lamareille, F., Maier, C., et al. 2009, ApJ, 696, 396 [NASA ADS] [CrossRef] [Google Scholar]
- Slob, M., Kriek, M., de Graaff, A., et al. 2025, A&A, 702, A110 [NASA ADS] [CrossRef] [EDP Sciences] [Google Scholar]
- Springel, V., Pakmor, R., Pillepich, A., et al. 2018, MNRAS, 475, 676 [Google Scholar]
- Stevenson, S. D., Carnall, A. C., Leung, H.-H., et al. 2026, MNRAS, 545, staf2087 [Google Scholar]
- Tacchella, S., Carollo, C. M., Renzini, A., et al. 2015, Science, 348, 314 [NASA ADS] [CrossRef] [Google Scholar]
- Tacchella, S., Dekel, A., Carollo, C. M., et al. 2016, MNRAS, 458, 242 [NASA ADS] [CrossRef] [Google Scholar]
- Thomas, D., Maraston, C., Schawinski, K., Sarzi, M., & Silk, J. 2010, MNRAS, accepted [arXiv:0912.0259] [Google Scholar]
- Toft, S., Zabl, J., Richard, J., et al. 2017, Nature, 546, 510 [NASA ADS] [CrossRef] [Google Scholar]
- Tomczak, A. R., Quadri, R. F., Tran, K.-V. H., et al. 2014, ApJ, 783, 85 [Google Scholar]
- Toni, G., Maturi, M., Castignani, G., et al. 2026, A&A, 707, A87 [NASA ADS] [CrossRef] [EDP Sciences] [Google Scholar]
- Valentino, F., Brammer, G., Gould, K. M. L., et al. 2023, ApJ, 947, 20 [NASA ADS] [CrossRef] [Google Scholar]
- van Dokkum, P. G., & Franx, M. 2001, ApJ, 553, 90 [NASA ADS] [CrossRef] [Google Scholar]
- Vijayan, A. P., Wilkins, S. M., Lovell, C. C., et al. 2022, MNRAS, 511, 4999 [NASA ADS] [CrossRef] [Google Scholar]
- Weaver, J. R., Kauffmann, O. B., Ilbert, O., et al. 2022, ApJS, 258, 11 [NASA ADS] [CrossRef] [Google Scholar]
- Weaver, J. R., Davidzon, I., Toft, S., et al. 2023, A&A, 677, A184 [NASA ADS] [CrossRef] [EDP Sciences] [Google Scholar]
- Weibel, A., de Graaff, A., Setton, D. J., et al. 2025, ApJ, 983, 11 [Google Scholar]
- Wilkins, S. M., Vijayan, A. P., Lovell, C. C., et al. 2023, MNRAS, 519, 3118 [Google Scholar]
- Williams, R. J., Quadri, R. F., Franx, M., van Dokkum, P., & Labbé, I. 2009, ApJ, 691, 1879 [NASA ADS] [CrossRef] [Google Scholar]
- Wuyts, S., Labbé, I., Förster Schreiber, N. M., et al. 2008, ApJ, 682, 985 [NASA ADS] [CrossRef] [Google Scholar]
- Wuyts, S., Förster Schreiber, N. M., van der Wel, A., et al. 2011, ApJ, 742, 96 [NASA ADS] [CrossRef] [Google Scholar]
- Yang, L., Kartaltepe, J. S., Franco, M., et al. 2025a, ApJS, 281, 68 [Google Scholar]
- Yang, T., Wang, T., Xu, K., et al. 2025b, ApJ, submitted [arXiv:2510.12235] [Google Scholar]
- Zhang, Y., de Graaff, A., Setton, D. J., et al. 2026, ApJ, 997, 252 [Google Scholar]
- Zolotov, A., Dekel, A., Mandelker, N., et al. 2015, MNRAS, 450, 2327 [Google Scholar]
Therefore, the empirical relation between the quenching probability and SFR in the Peng et al. (2010) model is indirect, thanks to the relation between black hole accretion rate and SFR (Silverman et al. 2009; Daddi et al. 2007).
Appendix A: Impact of quiescent classification criteria on the SMF
Several methods exist in the literature to separate quiescent and star-forming galaxies, that include rest-frame colors diagrams such as the traditional UVJ (Wuyts et al. 2008; Williams et al. 2009), NUVrK and NUVrJ (Arnouts et al. 2013; Ilbert et al. 2013), as well as sSFR cuts that are either fixed (e.g., log(sSFR/yr−1) = −10.5) or scale with the Hubble time as sSFR/yr−1 = 0.2/tH(z) (e.g., Fontana et al. 2009; Pacifici et al. 2016; Carnall et al. 2018). Adopting different criteria can result in different selections of quiescent galaxies, which can be mass dependent and affect the shape of the SMF. In this section we discuss how our classification is impacted by different selection methods, namely the NUVrJ diagram versus a sSFR-based selection.
In Fig. A.1 we show the cumulative histogram of the sSFR for the quiescent and star-forming samples selected using the NUVrJ color diagram. To demonstrate the dependence on stellar mass, we separated the samples in three stellar mass bins 8< log(M★/M⊙) < 9.5 (top), 9.5< log(M★/M⊙) < 10.5 (middle), and log(M★/M⊙) > 10.5 (bottom panel). This shows that the low-mass quiescent galaxies are most affected by the classification criterion — only about 60% of 8< log(M★/M⊙) < 9.5, NUVrJ-selected quiescent galaxies at all redshifts have log(sSFR/yr−1) < −10.5 and would be classified as quiescent by their sSFR too. More massive samples are more robust — over 90% (95%) of 9.5< log(M★/M⊙) < 10.5 (log(M★/M⊙) > 10.5) satisfy both the NUVrJ and the log(sSFR/yr−1) < −10.5 criteria. The star-forming sample is more robust — almost 100% of the low and intermediate mass NUVrJ-selected samples have log(sSFR/yr−1) > −10.5, while this drops to ∼90% for the log(M★/M⊙) > 10.5 sample.
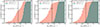 |
Fig. A.1. Cumulative histogram of the sSFR for NUVrJ selected quiescent and star-forming galaxies. The different panels show the distributions in three different stellar mass bins. The vertical black line marks log(sSFR) = −10.5 yr−1, typically used to separate quiescent and star-forming galaxies. |
We also investigated how the choice of quiescent selection criterion affects the stellar mass function (SMF). In Fig. A.2, we compare the quiescent and star-forming SMFs derived using the NUVrJ and an sSFR/yr−1 < 0.2/tH(z) selection. The high-mass end (log(M★/M⊙) > 10) is largely robust to the adopted criterion, with differences smaller than the statistical uncertainties of the SMF. At lower masses (log(M★/M⊙) < 10), however, the results diverge more substantially. For example, at z ∼ 1, the quiescent SMF exhibits a double-peaked shape and declines at log(M★/M⊙) < 8.5, while at z > 1.5 the low-mass upturn seen in the NUVrJ-based SMF largely disappears. These differences highlight that the inferred abundance and shape of the low-mass quiescent population depend sensitively on the adopted selection, which has implications for interpreting the physical mechanisms responsible for quenching in low-mass galaxies.
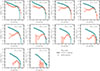 |
Fig. A.2. SMF for quiescent and star forming galaxies computed using the nominal NUVrJ rest-frame color diagram (solid line and envelope) and sSFR/yr−1 < 0.2/tH(z) (circles with error bars). While the high mass end of the SMF is robust with respect to the selection criterion, the low-mass end is highly sensitive. |
Appendix B: Fitting results
Tables B.1 and B.2 show the best fit values for the Schechter model parameters, SMD, and galaxy number densities.
Best-fitting single and double Schechter function parameters to the observed star-forming SMFs, where M* ≡ log(M★/M⊙).
Best-fitting single and double Schechter function parameters to the observed quiescent SMFs, where M* ≡ log(M★/M⊙).
All Tables
Best-fitting single and double Schechter function parameters to the observed star-forming SMFs, where M* ≡ log(M★/M⊙).
Best-fitting single and double Schechter function parameters to the observed quiescent SMFs, where M* ≡ log(M★/M⊙).
All Figures
|
Fig. 1. Rest-frame NUVrJ color diagram in the ten redshift bins we used to select the samples of star-forming and quiescent galaxies separated by the dashed black line (Eq. (1)). The histogram is color-coded according to the B/T ratio F115W at z < 2, F150W at 2 < z < 3, and F277W for z > 3. It includes sources with log(M★/M⊙) > 8.5. |
| In the text | |
|
Fig. 2. Stellar mass function for quiescent (left) and star-forming (right) galaxies in ten redshift bins from z = 0.2 to z = 5.5. The solid lines mark the measurements, and the filled areas envelop the 1σ confidence interval including Poisson, cosmic variance, and SED-fitting errors. The SMFs are measured with a bin size of Δlog M★ = 0.25. |
| In the text | |
|
Fig. 3. Stellar mass function for quiescent (red) and star-forming (teal) galaxies. Each panel, corresponding to a different z bin, shows the measurements (symbols) and best-fit intrinsic functions (solid lines and envelopes). The models are also shown extrapolated beyond the measured mass range. Comparison with recent literature works includes Weaver et al. (2023), McLeod et al. (2021), Santini et al. (2022), Baker et al. (2025) in gray symbols. This work indicates, for the first time, an upturn in the quiescent SMF at log(M★/M⊙) ≲9.5 out to z ∼ 3.25. |
| In the text | |
|
Fig. 4. Stellar mass function for quiescent galaxies separated by the bulge-to-total ratio. Each panel, corresponding to a different z bin, shows the measurements (symbols) and best-fit functions (solid lines and envelopes) for all quiescent (black), disk-dominated (B/T < 0.2, blue), intermediate (0.2 < B/T < 0.6, orange), and bulge-dominated galaxies (B/T > 0.6, dark red). The models are also shown extrapolated beyond the measured mass range. |
| In the text | |
|
Fig. 5. Stellar mass function for star-forming galaxies separated by the bulge-to-total ratio. Each panel, corresponding to a different z bin, shows the measurements (symbols) and best-fit functions (solid lines and envelopes) for all quiescent (black), disk-dominated (B/T < 0.2, blue), intermediate (0.2 < B/T < 0.6, orange), and bulge-dominated galaxies (B/T > 0.6, dark red). The models are also shown extrapolated beyond the measured mass range. |
| In the text | |
|
Fig. 6. Stellar mass and number density of quiescent and star-forming galaxies. The left panel shows the stellar mass density for total quiescent and star-forming population and for the B/T-selected quiescent samples for log(M★/M⊙) > 8. It also includes a literature comparison from recent observational studies. The right panel shows the number densities of galaxies with log(M★/M⊙) > 10 selected using the NUVrJ rest-frame colors and an sSFR/yr−1 < 0.2/tH(z) selection for the quiescent population from our work. We compare them with a compilation of simulations (lines) and observations (symbols with error bars). All are selected to have log(M★/M⊙) > 10, but the quiescent classification varies for the different observational works. In the simulations, quiescent galaxies are classified as sSFR < 5 × 10⁻¹¹ yr−1 and include uncertainties by convolving the stellar masses with Gaussian-distributed errors with a width of 0.3 dex. In our work, the sSFR selection yields ngal lower by ∼0.2 − 0.5 dex at z ≳ 4 than the NUVrJ selection. |
| In the text | |
|
Fig. 7. Fraction of quiescent and bulge-dominated galaxies as a function of stellar mass in the ten redshift bins from z = 0.2 to z = 5.5. The first panel shows the fraction of quiescent to all galaxies, the second panels shows the fraction of quiescent bulges to all quiescent galaxies, the third panel shows the fraction of star-forming bulges to all star-forming galaxies, and the fourth panel shows the fraction of star-forming bulges to the total bulge population. |
| In the text | |
|
Fig. 8. Comparison of the observed quiescent SMF with semianalytical models and hydrodynamical simulations. These include SHARK (Lagos et al. 2018, 2024) run with two alternative runs with slow and fast ram-pressure stripping, GALFORM (Lacey et al. 2016), GAEA (De Lucia et al. 2024), SIMBA (Davé et al. 2019), EAGLE (Schaye et al. 2015; Crain et al. 2015), AND TNG100 (Springel et al. 2018; Pillepich et al. 2018). They were computed using a UVJ color selection and include uncertainties by convolving the stellar masses with a Gaussian kernel of 0.3 dex. |
| In the text | |
|
Fig. 9. Best-fit Schecher function parameters as a function of redshift. The symbols with error bars show the best-fit and 1σ uncertainties for the total quiescent and star-forming galaxies. The lines show the best-fit values for the disk-dominated (B/T < 0.2, blue), intermediate (0.2 < B/T < 0.6, orange), and bulge-dominated (B/T > 0.6, dark red) SMFs. |
| In the text | |
|
Fig. 10. Empirical modeling of the number densities of star-forming and quiescent galaxies as well as their bulge-dominated subpopulations. The symbols correspond to the measurements, and the curves show the best-fit models as described by the set of differential equations. The bottom panels show the best-fit parametric forms of the quenching rates, integrated SFE, and bulge formation function. |
| In the text | |
|
Fig. A.1. Cumulative histogram of the sSFR for NUVrJ selected quiescent and star-forming galaxies. The different panels show the distributions in three different stellar mass bins. The vertical black line marks log(sSFR) = −10.5 yr−1, typically used to separate quiescent and star-forming galaxies. |
| In the text | |
|
Fig. A.2. SMF for quiescent and star forming galaxies computed using the nominal NUVrJ rest-frame color diagram (solid line and envelope) and sSFR/yr−1 < 0.2/tH(z) (circles with error bars). While the high mass end of the SMF is robust with respect to the selection criterion, the low-mass end is highly sensitive. |
| In the text | |
Current usage metrics show cumulative count of Article Views (full-text article views including HTML views, PDF and ePub downloads, according to the available data) and Abstracts Views on Vision4Press platform.
Data correspond to usage on the plateform after 2015. The current usage metrics is available 48-96 hours after online publication and is updated daily on week days.
Initial download of the metrics may take a while.