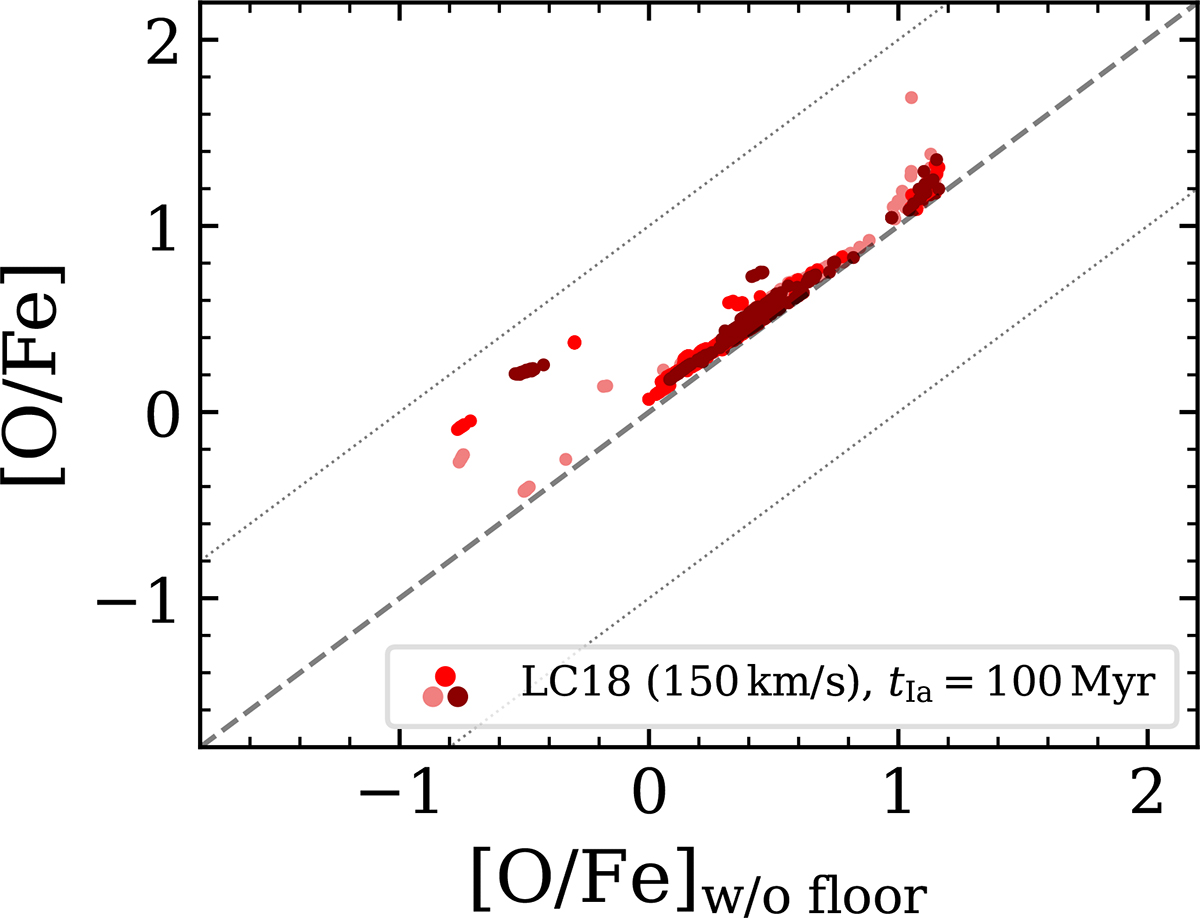
Fig. A.1.
Download original image
Comparison between the abundance of two identical tracers of oxygen, one of which (vertical axis) includes an initial floor of 2 × 10⁻⁵ to promote gas cooling at early times. The figure includes data from three simulations with different seed for random number generation but the same model; yields from LC18, 150 km s−1 for massive stars and tIa = 100 Myr).
Current usage metrics show cumulative count of Article Views (full-text article views including HTML views, PDF and ePub downloads, according to the available data) and Abstracts Views on Vision4Press platform.
Data correspond to usage on the plateform after 2015. The current usage metrics is available 48-96 hours after online publication and is updated daily on week days.
Initial download of the metrics may take a while.