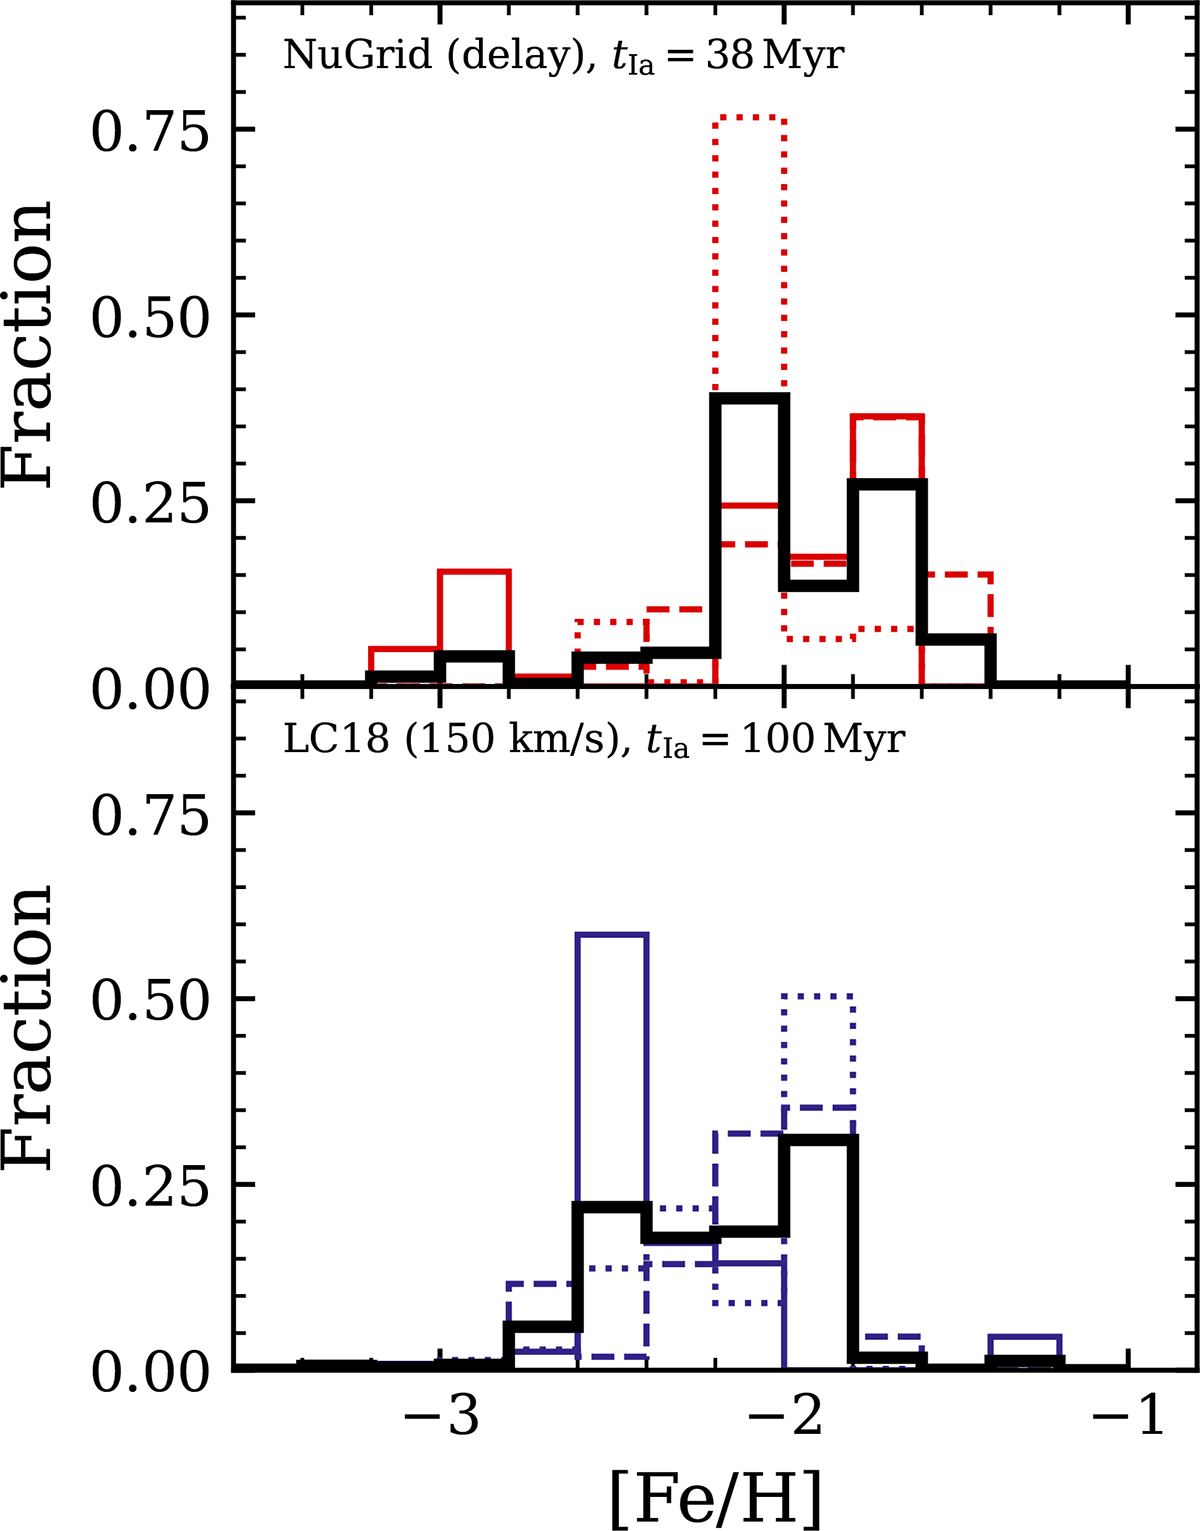
Fig. 5.
Download original image
MDF of [Fe/H] of six simulations used to estimate the stochastic variance, each displayed showing the fraction of stars in bins with size 0.2 dex, comparable to the typical errors on observed estimates of these quantities. The colored lines show individual simulations, each distinguished by different lines, while the black lines show the combined MDF of all simulations using the same model. The top row shows results from the NUGRID (delay) model with SNIa delay time of 38 Myr, and the bottom row shows results from the LC18 model with 150 km s−1 rotation and a delay time of 100 Myr for SNIa. Each row includes three simulations (different line styles) executed with a different seed for random number sampling.
Current usage metrics show cumulative count of Article Views (full-text article views including HTML views, PDF and ePub downloads, according to the available data) and Abstracts Views on Vision4Press platform.
Data correspond to usage on the plateform after 2015. The current usage metrics is available 48-96 hours after online publication and is updated daily on week days.
Initial download of the metrics may take a while.