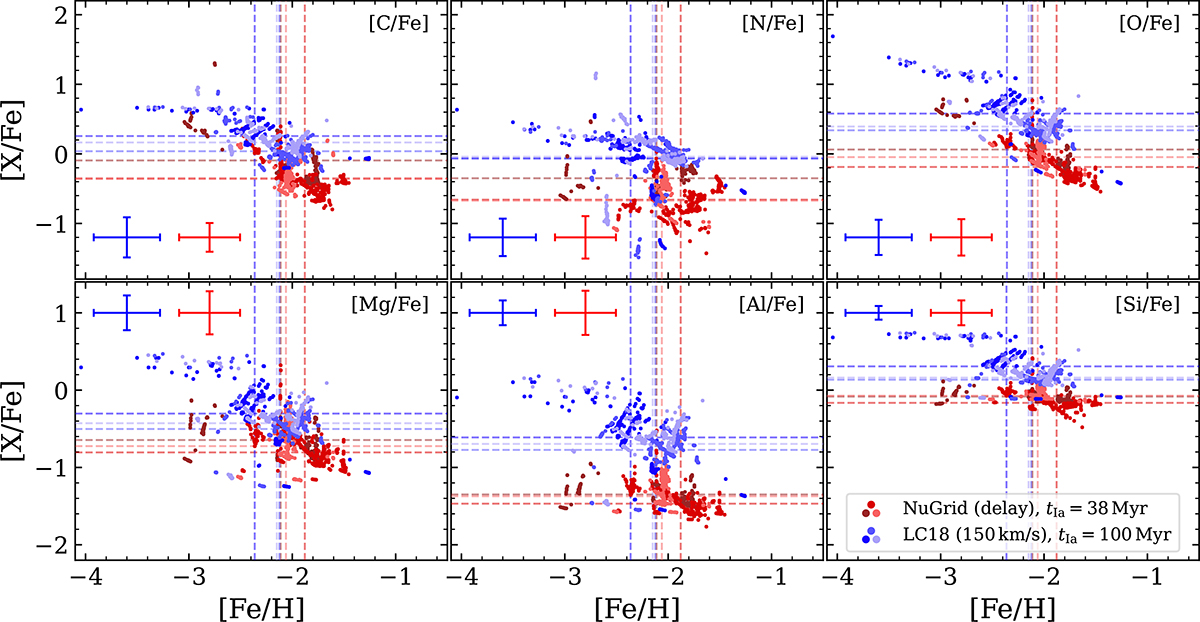
Fig. 7.
Download original image
Abundances relative to Fe as a function of [Fe/H] for different elements as indicated by the label in the upper right corner of each panel. The figure includes data from two different models in different shades of red and blue, as is indicated by the legend in the bottom right panel. For each model, different color shades present different simulations, varying only the random seed for IMF and SNIa sampling. The dashed vertical lines mark the mean value on the corresponding axis for each simulation. Included in the bottom (top) left of the top (bottom) row are colored error bars that show the total dispersion accounting for all stars in the three simulations of the corresponding color.
Current usage metrics show cumulative count of Article Views (full-text article views including HTML views, PDF and ePub downloads, according to the available data) and Abstracts Views on Vision4Press platform.
Data correspond to usage on the plateform after 2015. The current usage metrics is available 48-96 hours after online publication and is updated daily on week days.
Initial download of the metrics may take a while.