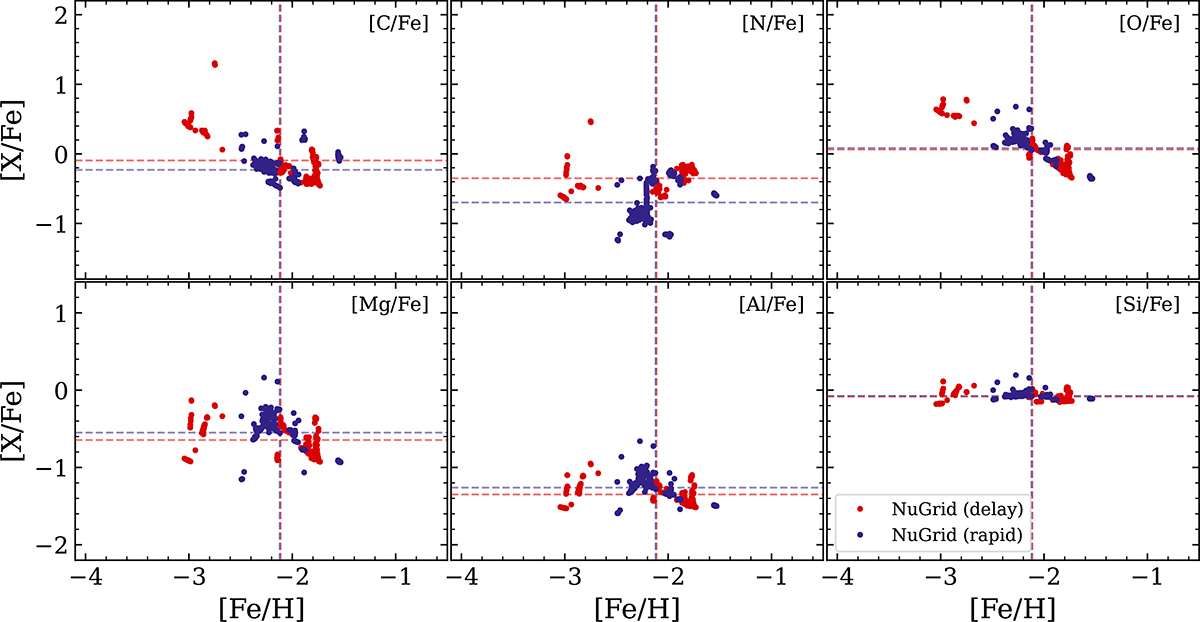
Fig. 8.
Download original image
Abundances (relative to iron) for the elements in our simulations (indicated in the top right of each panel), all as a function of iron abundance (relative hydrogen). The figure shows results from simulations that apply yields from NUGRID, including the delayed and rapid timing models for core-collapse explosion trigger (see main text for details). The mean value of all stars along each axis is shown by dashed lines in the color assigned to the model (see legend).
Current usage metrics show cumulative count of Article Views (full-text article views including HTML views, PDF and ePub downloads, according to the available data) and Abstracts Views on Vision4Press platform.
Data correspond to usage on the plateform after 2015. The current usage metrics is available 48-96 hours after online publication and is updated daily on week days.
Initial download of the metrics may take a while.