Open Access
Fig. 1
Download original image
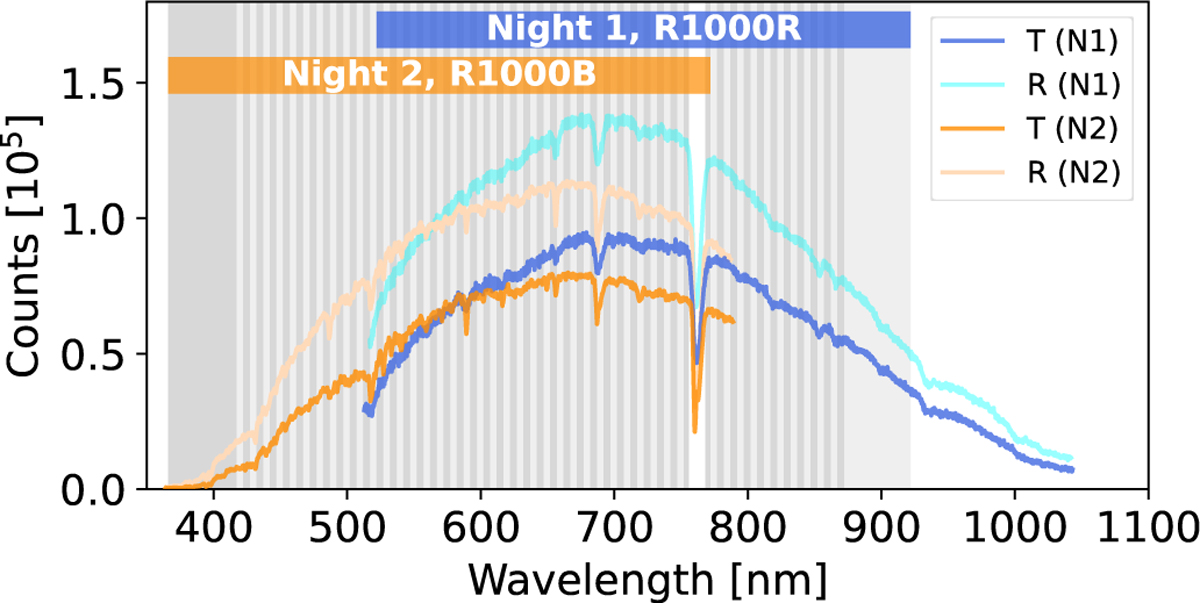
Example stellar spectra of NGTS-5 (T; darker line) and its reference star (R; lighter line), observed with the R1000R grism on Night 1 (blue) and the R1000B grism on Night 2 (orange). The vertical lines with gray-shaded regions indicate the adopted spectroscopic passbands.
Current usage metrics show cumulative count of Article Views (full-text article views including HTML views, PDF and ePub downloads, according to the available data) and Abstracts Views on Vision4Press platform.
Data correspond to usage on the plateform after 2015. The current usage metrics is available 48-96 hours after online publication and is updated daily on week days.
Initial download of the metrics may take a while.